Download
1 / 22
320 likes | 719 Vues
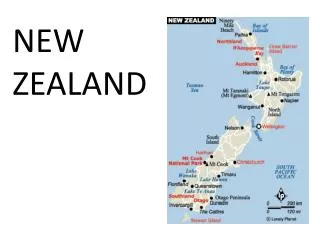
New Zealand’s dairy industry. Hon. John Luxton Chairman DairyNZ. Introducing NZ dairy farming. DairyNZ tvc. New Zealand is 1/10 th the size of Argentina. Mercosul & NZ milk production. Source: IBGE, SAGyPA Indicator Series, ODEPA, OPYPA, LIC, FAO

E N D
New Zealand’s dairy industry Hon. John Luxton Chairman DairyNZ
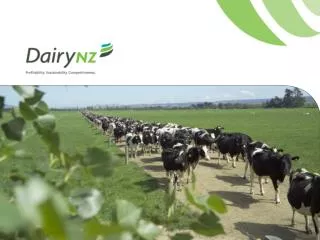
IntroducingNZ dairy farming • DairyNZ tvc
Mercosul & NZ milk production Source: IBGE, SAGyPA Indicator Series, ODEPA, OPYPA, LIC, FAO Notes: 1) NZ base year is 2000/01 season.
Brazil Dairy Industry Background International milk prices Source: LIC,USDA, ODEPA, OPYPA, ESALQ
Dairying in New Zealand • 1.46 million ha used • >85% grazed pasture • 16.5 billion litres • 8th largest producer • Only 2.3% of world production
Dairy Industry comprises ~25% of NZ’s export receiptsMilk price = international price… no tariffs and support
How we compare IFCN 2010 Dairy Report
Calving is seasonal 100 Conservation required Supplement required 75 Pasture (kg DM/ha per d) Demand 50 Feed supply 25 Spring
The farming structure is evolving towards bigger farms and fewer farmers Source: LIC Dairy Statistics, DairyNZ Economics Group
Production by herd size 2009-10 Source: DairyNZ Economics Group
Milksolids production 6% 28% 7% 11% 9% 4% 18% 17%
NZ Export Markets Source: Statistics New Zealand, DairyNZ Economics Group
Major processing companies • Fonterra Cooperative Group: • 90 percent of milk supply and exports • 40 percent of the domestic consumer market • 2 other co-operatives: • Tatua • Westland • 5 other processing companies: • Open Country Dairies • Synlait • New Zealand Dairies • Goodman Fielder • Farmers own 95%+ of processing capacity
DIRA • Open entry and exit • Contracting rules • 20% rule • Raw milk regulations
Fonterra milk price model • Calculates revenue if all milk was processed into basic commodities & sold overseas • Deducts shipping, processing & freight costs • Balance paid to farmers as milk price • Value add – eg selling premium ingredients/ investment in consumer brands – treated as profit • Farmers receive profit as dividends on their Fonterra shares, plus price paid for raw milk
Looking ahead • Dairy making large & growing contribution • Global supply/demand supports NZ growth • On-farm business success $83/ha/yr • Erosion of NZ’s low cost base poses threat • Imperatives for productivity improve remain • Public & consumers driving sustainability • Public perceptions about dairy are mixed • Skilled people increasingly important • Unified approach to innovation & adoption
Questions? Improving productivity