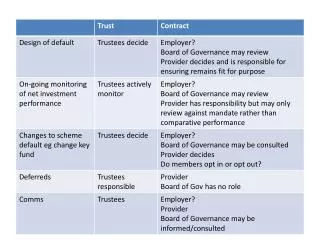
Achievability Calculation in Resource Conservation Advisory Committee Meeting, March 12, 2009
Learn how achievability is calculated and used in conservation resource management with a focus on long and short-term penetration assumptions, consequences of assumptions, and more discussed in the March 12, 2009 meeting outline.

Achievability Calculation in Resource Conservation Advisory Committee Meeting, March 12, 2009
E N D
Presentation Transcript
Achievability Issues Conservation Resources Advisory Committee March 12, 2009
Outline • How Achievability is Used & Calculated • Consequences of Assumptions • Interaction with Stock Estimates • Near-Term Penetration Assumptions • Long-Term Penetration Assumptions
How Achievability is Used Conservation Resources Generating Resources Demand Response Imports Load Prices for Fuel, Capital, CO2, Siting, … Similarly Reliable & Available Resource Options Reliability Constraints Time-Dependent Cost & Availability Regional Portfolio Model Develops Plans & Analyzes Cost & Risk for Plans (Plans are Amount and Timing of Resource Decisions)
Consequences: • Near-Term Achievability Penetration • Acts as Practical Limit on Deployment • Impacts Near-Term Targets • Impacts Risk-Mitigation Premium • Higher Cost-Effective Limit for Lost-Opportunity • Long-Term Achievability • Recognizes Can’t Get it All • Retain 85% Max Penetration for 6th Plan • Some Less (HPWH, Solar PV, Set-Top, LED Sign)
How Achievability is Calculated Lost Opportunity Remaining Stock Estimate (or Technical Potential) Achievable Penetration x Non-Lost Opportunity Long-Term Achievable over 20 Years Near-Term Penetration Rates Year by Year Maximum Penetration
Lost-Opportunity & RetrofitStock Estimates Lost-Opportunity Conservation Incremental Cost & Savings Compared to New Baseline Limited to Annual Stock or Unit Availability New Homes, Buildings & Equipment (Driven by Population Growth & Equip Saturation) Replacement Systems & Equipment (Driven by Stock Turnover Rates) Retrofit Conservation Incremental Cost & Savings Compared to Retrofit Baseline Limited to Remaining Stock 2029 Existing Building Stock not addressed by turnover (e.g. weatherization) Systems & Equipment with Slow Turnover Rates (e.g. windows)
Applicable Stock Estimates • Estimates are Measure-Specific & Interactive • Lost-Opportunity • New Stock • Function of Population & Employment & Economy • Replacement Equipment • Function of equipment turnover & remodel rates • Ex: Lighting system turnover rate higher in Retail than Schools • Retrofit • Existing Stock • Minus Demolition & Conversion & Replacement • Plus New & Replacement not addressed as Lost-Opps
5th PlanAchievable Penetration Rates Ramp 15% to Max 85% in 12 Years (Ramp Up 14 MWa to 85 MWa per Year @$100/MWh) Lost-Opportunity Conservation Retrofit Conservation Limited to 120 MWa per Year Based on High Historical Performance Max 85%
Developing 6th Plan Achievable Penetration Rates Two Approaches • Historic Perspective • Recent Regional Performance • Forward-Looking • Build from Bottom Up • Measure-by-Measure Penetration Rates
Historic Perspective Program Performance Pace of Codes & Standards Periodic Survey of Current Stock Forward Looking Considers Character of Measures Implementation Strategies Size & Cost Physical Availability of Equipment Training & Education Requirements Near-Term Achievability
BPA, Utility & NEEA Programs Averaged 150 MWa per year since 2001 Over 200 MWa in 2007 Probably >200 MWa in 2008 At $40-50 /MWh Avoided Costs Codes & Standards One third of Savings since 1991 Large Long-Term Potential Near-Term Impact Limited by New Stock Additions & Turnover Rates Historic Perspective
Forward-Looking Use a Bottom-Up Approach to EstimatePenetration Rates • Estimate Annual Penetration Rates by Measure Bundle • Distinguish Features that Impact Penetration Rate • Complexity of Measures • Delivery Mechanisms & Decision Makers • Current Market Saturation • Equipment & Infrastructure Availability • Subject to Code or Standard • Size & Cost • (Annual Penetration Rate) x (Annual Units) x (Unit Savings) • Then Sum of All Measure-Level Supply Curves by Year & Levelized Cost bin
Lost-Opportunity Emerging Technology LO Slow LO Medium LO Fast Retrofit New Measure In 20 Years In 10 Years In 5 Years Penetration Rate “Families”
LO Slow Refrigerators Freezers Cooking Heat Pump Upgrades Elec Furnace to HP Conversions LO Medium Clothes Washer Dishwasher Clothes Dryer Shell & Window Measures Window AC Units Residential Lost-OpportunityAchievable Penetration Rate Themes About 340 MWa by 2029 About 540 MWa by 2029 LO Emerging Technology • Heat Pump Water Heater • Gravity Film Heat Exchanger About 600 MWa by 2029
Retro in 5 Years Showerheads Lighting Retro in 15 Years Weatherization HVAC Conversions Residential RetrofitAchievable Penetration Rate Themes About 240 MWa by 2029 About 750 MWa by 2029 New Measure Ramp-Up • Solar DHW • Solar PV About 610 MWa by 2029
LO Fast Lighting Power Density Lighting Controls Premium HVAC Equipment Variable-Speed Chillers Glass – New & Replacement Simple HVAC Measures – New Package Refrigeration Equip Exterior Building Lighting Street & Roadway Lighting - New LO Medium Integrated Building Design Daylighting Complex HVAC Measures Street & Roadway Lighting - Repl Parking Lighting Signage Commercial Lost-OpportunityAchievable Penetration Rate Themes About 180 MWa by 2029 About 740 MWa by 2029
Retro in 10 Years Lighting Power Density Lighting Controls Glass – Retrofit Simple HVAC Measures Insulation DCV Restaurant Hoods Computer Servers & IT Retro in 20 Years Controls Commissioning Complex Complex HVAC Measures Grocery Refrigeration Network PC Controls Sewage Treatment Water Supply Commercial RetrofitAchievable Penetration Rate Themes About 350 MWa by 2029 About 180 MWa by 2029
LO Fast Lighting Power Density Lighting Controls LO Medium Material Handling Motor Rewind Industrial Lost-OpportunityAchievable Penetration Rate Themes About 60 MWa by 2029 About 70 MWa by 2029
Retro in 10 Years Compressed Air Measures Centrifugal Fans Belts Transformers Refrigeration & Food Storage Chip Fab Measures Retro in 20 Years Fan & Pump Optimization Premium Fan & Pump Equip Pulp & Paper Equipment Industrial RetrofitAchievable Penetration Rate Themes About 170 MWa by 2029 New Measure Ramp-Up (?) • Plant Energy Management • Energy Project Management • Integrated Plant Energy Management About 250 MWa by 2029 About 250 MWa by 2029
Retro in 10 Years Scientific Irrigation Systems Irrigation Hardware Dairy Agriculture RetrofitAchievable Penetration Rate About 110 MWa
Distribution System RetrofitAchievable Penetration Rate New Measure Ramp-Up Medium • Line Drop Compensation • VAR Management. Phase Load Balancing, & Feeder Load Balancing • Substation Voltage Regulators & Select Re-Conductoring • End-of Line Voltage Control Regulators About 420 MWa by 2029
Initial ResultsBottom Up Lost-Opportunity Supply Curve 2010-2019
Reference Slides • Residential Measures • Commercial Measures • Industrial Measures ALL NUMBERS ARE SUBJECT TO REVISION!
Preliminary Draft 6th Plan Residential Water Heating, Lighting and Appliance Supply Curve
Preliminary Draft 6th Plan Residential Space Conditioning Supply Curve
Commercial Sector Achievable Savings Potential by End Use by 2029
Building-Related MeasuresCumulative Achievable MWa Savings 2030
Equipment-Related MeasuresCumulative Achievable MWa Savings 2030