Download

1 / 58
580 likes | 802 Vues
Gross Domestic Product (GDP) and Business Fluctuations. MSc EPS Hilary term 2013 (S2) Professor Dermot McAleese. OUTLINE. Definition of GDP Real vs. nominal GDP GDP vs. GNP GDP estimation Shadow vs Official Economy PPP vs. current exchange rate

E N D
Gross Domestic Product (GDP) and Business Fluctuations MSc EPS Hilary term 2013 (S2) Professor Dermot McAleese
OUTLINE Definition of GDP Real vs. nominal GDP GDP vs. GNP GDP estimation Shadow vs Official Economy PPP vs. current exchange rate Potential GDP and the output gap Business Fluctuations
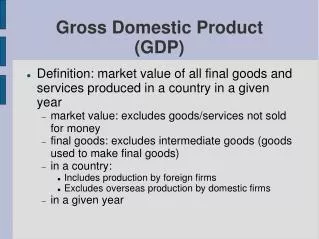
GROSS DOMESTIC PRODUCT (GDP) GDP refers to the output of goods and services produced in an economy during a specific period of time. The importance of GDP statistic Business forecasts Monetary and fiscal policy Political significance International comparisons
Real vs. Nominal GDP Nominal GDP is the current value of output (goods and services) produced in an economy. Real GDP measures volume of output. computed by valuing the quantities of goods and services produced in 2 periods with the same set of prices. Year 1: P1x X1 + P1y Y1 (5, 10) (8, 12) €146 Year 2: P2x X2 + P2y Y2 (6, 11) (9, 14) €192 (+31%) To compute real GDP: (1) Calculate value of Year 2 quantities at Year 1 prices P1x X2+ P1y Y2 = 5 x 11 + 8 x 14 = 55+112= 167 (2) Express this as % of base year GDP. Real GDP increased by 14%.
GDP vs GNP (GNI) GDP is output produced by productive factors located in the country, regardless of their owners’ nationality. GNP refers to output produced by productive factors owned by permanent residents (‘citizens’) of a country. For most countries the difference is very small
Countries with GDP > GNP -- Top 16 GDP-GNP (% of GDP) WDI 2007 World Bank CDRom
Countries with GNP > GDP -- Top 16 % gap Memo: China 0.5% US 0.3% World Bank Indicators 2007 (GNP-GDP)/GDP * 100
Production Income Expenditure HOW TO COMPUTE GDP Disposal income of households + Non distributed profits + Net direct taxes = National Income Private consumption + Gross Investment (incl. inventories) + Public Consumption + Exports - Imports (including income flows) Value added = Gross Domestic Product ___________ ______ Net Indirect Taxes ____________ Depreciation
GDP = C + I + G + X - M C = private sector consumption I = investment (capital formation) G = government current spending X = exports of goods and services M = imports of goods and services
Composition of EU GDP Source: European Economy 2011
GDP by sector Source: WTO Trade Policy Review “European Communities” 22 Jan 2012
Real US after-tax income (% increase 1979-2007) Average income increase 1979-2007 62% Median income increase 1979-2007 35% Martin Wolf “Romney would be a backward step” FT Wed Oct 31st 2012
CBO = Congressional Budget Office, Washington DC Congressional Budget Office, Washington DC
Real US after-tax income By percentile, % increase, 1979-2007 Source: Congressional Budget office Report November 2011
CBO Report Oct 2011 Ref to OECD study 2008
Purchasing Power Parity (PPP) 1. Nominal exchange rate in 2008 was 6.9 Yuan = US$1 . Hence $1000 = 6,900 yuan. 2. Buy a representative basket of goods and services in Washington DC. A representative basket might, for example, contain 2 kilos of rice 1 kilo beef 5 inner city bus rides one month’s rent of a two-bed apartment 1 personal computer 2 visits to doctor etc. (the list could run into hundreds of items) 3. Suppose this representative basket costs $1,000 to buy in Washington. Now buy exactly the same basket in China. Suppose it costs 3,800 yuan. Purchasing Power Parity (PPP) rate of exchange = 3,800 yuan divided by $1000 PPP exchange rate: 3.8 yuan = $1 4. GDP per head in China (2008) = 22,640 Yuan = $3,260 at nominal exchange rate. [6.9 yuan per dollar]. China’s GDP per head of 22,640 yuan per head = $5,962 at PPP (3.8 yuan per dollar].
GDP calculated from nominal exchange rates underestimates the living standards of developing countries • This happens because non traded goods (services) are much cheaper in developing countries Divergences in prices of traded goodsare much less because of the law of one price The gap between GDP measured at current exchange rate and GDP measured at PPP can be substantial
Review Questions In HDR 2011 table, most countries’ GDP per capita is higher in PPP than in current exchange rates. For some countries GDP at current exchange rates is higher than in PPP terms. What is the reason for this difference?
Shares of world production -- PPP vs current exchange rates (%) Source: Bank of America 2006
‘The Gross National Product does not allow for the health of our children, the quality of their education or the joy of their play. It does not include the beauty of our poetry or the strength of our marriages; the intelligence of our public debate or the integrity of our public officials. It measures neither our wisdom nor our learning neither our compassion nor our devotion to our country; it measures everything, in short, except that which makes life worthwhile.’ Robert F. Kennedy (1968) quoted in Finance and Development, December 1993, p. 20
The basic purpose of development is to enlarge people’s choices. People often value achievements that do not show up at all, or not immediately, in income or growth figures: greater access to knowledge, better nutrition and health services, more secure livelihoods, security against crime and physical violence, satisfying leisure hours, political and cultural freedoms and sense of participation in community activities. The objective of development is to create an enabling environment for people to enjoy long, healthy and creative lives. Mahbub ul Haq, Founder of the Human Development Report.
Classwork pp 273-274 • E1, E2, E3 • Q1 (p 273)
Which of the following transactions should be included as part of GDP?(a) A consumer pays €10 for a meal at the restaurant(b) A company buys a plant from another firm for €1 million.(c) A supplier sells computer chips to another firm that makes personal computers.(d) A person buys a second-hand car from a dealer for €5,000.(e) A person buys a new car for €15,000.(f) A factory exports €2m worth of PCs and sells €5m on the domestic market. It imports €2m component parts for the PCs.(g) Chinese residents abroad send €5m to their relatives in China; China gives €5m aid to UN; Chinese temporary workers earn €5m in foreign countries
2. A person saves €10,000 of this year's income and spends it on new machinery. Explain how this would be recorded in the national accounts. Another person takes €10,000 from a deposit account and buys shares on the stock market. Would this be recorded in GDP?
Ex 3 p 274 Consider an economy with only three goods. Their market prices are P1 = 5, P2 = 10 and P3 = 15. The production (and consumption) of each good during 2002 was Q1 = 20, Q2 = 25 and Q3 = 10.(a) What is the value of nominal GDP?(b) Assume that in 2003 prices rise to P1 = 6, P2 = 12 and P3 = 17, and quantities produced (and consumed) go to Q1 = 21, Q2 = 27 and Q3 = 11. Calculate the value of nominal GDP. Compute real GDP, using 2002 prices as the base year. What is the real rate of growth of the economy? What is the rate of inflation? (c) Calculate the change in real GDP using 2003 prices as the base year. Explain why your answer is different to that in (b).
Shadow vs Official Economy (DMcA p.150) TOTAL ECONOMIC ACTIVITY FORMAL ECONOMY SHADOW ECONOMY Non-marketed economic activity Non-marketed economic activity Marketed economic activity Marketed economic activity TOTAL MARKET ECONOMY
Estimates of size of shadow economy March 2002 study shows from sample of 85 countries • 35-44% average range in developing countries (Nigeria and Egypt 77 and 69%, Thailand 70%, while only 14% in HK and Singapore, 19% in Chile) • 21-30% in transition countries Georgia 64%, Russia 44% • 14-16% in developed countries (US 10%) Source: F Schneider and D. Enste “Hiding in the Shadows: the Growth of the Underground Economy” IMF Economic Issues 30, Washington DC 2002
Size of the shadow economy (% GDP) Source: DMcA Economics for Business; F Schneider “The influence of the economic crisis on the underground economy” University of Linz, Austria Jan 2010
POTENTIAL GDP and the OUTPUT GAP Potential GDP is the maximum output that an economy can produce if capital, labour and other factors of production are fully utilised, consistent over the medium term with price stability. The Output Gap = [(actual GDP - potential GDP)/ potential GDP] x 100
POTENTIAL VS. ACTUAL GDP Actual GDP > Potential GDP price stability in jeopardy, indicators point to inflation Actual GDP < Potential GDP resources being wasted, unemployment, indicators point to recession Actual > Potential Real GDP Actual < Potential Actual Potential time time
Output gaps for 2012 and 2013 Notes: Output gap = [(actual GDP - potential GDP)/ potential GDP] Source: OECD, Economic Outlook, May 2012 40
ESTIMATION OF POTENTIAL GDP Trend extrapolation Production function approach Growth in potential output Growth in government sector Growth in the business sector Growth in capital stock Growth in employment Growth in TFP Advances in technology Enterprise-friendly economic policies
Class exercise: define headings and interpret statistics in this table Source: OECD Nov 2011
Class exercise: define headings and interpret statistics in this table OECD June 2012
Business Fluctuations (ch 16) • What are business fluctuations? • Why do they matter? • What causes them? • What can be done about them? --- next sessions – MONETARY AND FISCAL POLICY
What are business fluctuations? Business fluctuations are fluctuations in aggregate economic activity that are widely diffused throughout the economy and have identifiable “peaks” and “troughs” FLUCTUATIONS CYCLES
THE BUSINESS CYCLE WILL NOT DISAPPEAR …. The inevitability of the business cycle, as it used to be called, I take for granted. Good times bring into existence: first, incompetent business executives; second, wrongful government policies; and, third, speculators. Working together, they ensure the eventual bust. J K Galbraith “Challenges of the New Millennium”Finance and Development December 1999 p 5
Average growth rate 2.93%