Download
1 / 28
280 likes | 472 Vues
Diagnosing Your Application on the JVM. Staffan Larsen Java SE Serviceability Architect staffan.larsen@oracle.com @stalar. Notice.

E N D
Diagnosing Your Application on the JVM Staffan LarsenJava SE Serviceability Architect staffan.larsen@oracle.com @stalar
Notice THE FOLLOWING IS INTENDED TO OUTLINE OUR GENERAL PRODUCT DIRECTION. IT IS INTENDED FOR INFORMATION PURPOSES ONLY, AND MAY NOT BE INCORPORATED INTO ANY CONTRACT. IT IS NOT A COMMITMENT TO DELIVER ANY MATERIAL, CODE, OR FUNCTIONALITY, AND SHOULD NOT BE RELIED UPON IN MAKING PURCHASING DECISION. THE DEVELOPMENT, RELEASE, AND TIMING OF ANY FEATURES OR FUNCTIONALITY DESCRIBED FOR ORACLE'S PRODUCTS REMAINS AT THE SOLE DISCRETION OF ORACLE.
404 – Not Found java.security.AccessControlException: access denied ("java.lang.management.ManagementPermission" "control") at java.security.AccessControlContext.checkPermission(AccessControlContext.java:364) at java.security.AccessController.checkPermission(AccessController.java:555) at java.lang.SecurityManager.checkPermission(SecurityManager.java:549) at oracle.jrockit.jfr.JFR.checkControl(JFR.java:43) at oracle.jrockit.jfr.RepositoryChunk.<init>(RepositoryChunk.java:68) at Demo$1.<init>(Demo.java:14) at Demo.start(Demo.java:14) at sun.applet.AppletPanel.run(AppletPanel.java:474) at java.lang.Thread.run(Thread.java:722)
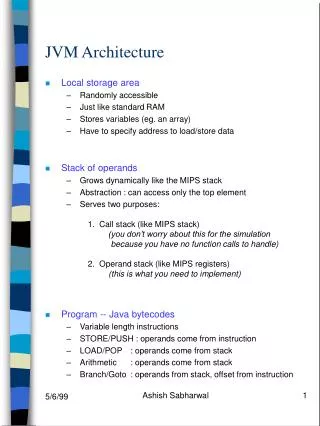
jstack attach JMX jinfo jstatd jps jvisualvm jstat jcmd perf counters jmap serviceability agent
Demos, walk-through • Internals • Future Agenda
Demos, walk-through • Internals • Future Agenda
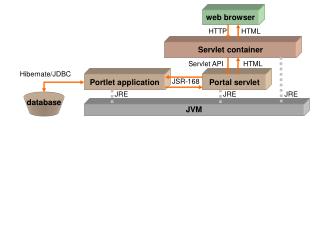
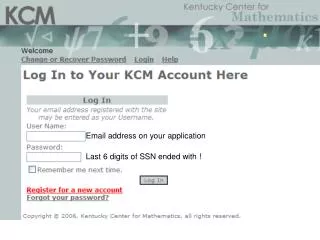
Remote access • JMX • jvisualvm, jconsole • Access information from java.lang.managementMBeans • SSL and authentication • Enable startup: -Dcom.sun.management.jmxremote • Enable runtime: jcmdManagementServer.start • jstatd • Daemon that runs on remote machine • jstat can connect to daemon New!
Discovery What is running on my system? • Well-known file for each JVM • <temp>/hsperfdata_<user>/<pid> • /tmp/hsperfdata_staffan/3636 • Created on JVM startup • Deleted on JVM shutdown • Unused files deleted on startup
Java Discovery Protocol JDP From freedigitalphotos.net/by digitalart
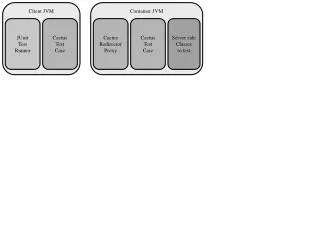
Attach Talking to the JVM • Allows sending "commands" for execution in the JVM • Receive text output • Local access by same user only • Used by jcmd, jstack, jmap • Mechanics differ on platforms
Attach: Linux / BSD / Solaris • Create file /tmp/.attach_pid<pid> • Send SIGQUIT to JVM • JVM looks for /tmp/.attach_pid<pid> • If not found a normal thread dump is done • JVM will create /tmp/.java_pid<pid> socket • Use socket for communication • Solaris uses door API instead of socket
Attach: Windows • Remote process injects code (!) into the JVM • VirtualAllocEx / WriteProcessMemory • Remote process creates a thread in the JVM to call the code • CreateRemoteThread • The code dynamically looks up JVM_EnqueueOperation() and calls it • Reads result from a pipe
Diagnostic Commands • Helper routines inside the JVM • Text output • Executed via the jcmd utility (soon JMX) • Self-describing help facility • Different set of commands for different JVM versions Coming Soon!
jvmstat / PerfCounter • /tmp/hsperfdata_staffan/3636 • Contains a lot of run-time information about the JVM • Memory mapped file • Updated continuously by JVM • Use jstat to show information in readable form • Use "jcmd PerfCounter.print" to see raw contents
Accessing the JVM jcmd jstack jmap jinfo Monitored JVM JMX JMX RMI j* jstat(d) jstat JMX client dcmd JVM attach jvmstat attach Mission Control VisualVM JConsole
Serviceability Agent • For core-files or non-responsive JVMs • Uses debugger to read information • Last resort - suspends process in unknown state jstack <executable> <core> jstack –F <pid>
Accessing the JVM jstack jmap jinfo Monitored JVM j* JVM vmSymbols SA debugger
Java Mission Control • Java Mission Control
Java Flight Recorder • JVM-built-in profiler and tracer • Non-intrusive • Always-on • Circular buffers • Captures both JVM and application data • GC, Locks, Compiler, Exceptions, CPU Usage, I/O, … … • After-the-fact analysis New! Photograph by Jeffrey Milstein http://butdoesitfloat.com/In-the-presence-of-massive-gravitational-fields-this-perfect
Demos, walk-through • Internals • Future Agenda
Future It’s soon here! • More Diagnostic Commands (jcmd) • Eventually replacing jstack, jmap, jinfo • JMX 2.0 • Improved Logging for the JVM • JEP 158 • Deprecate JConsole, hprof agent (?)
Take-away • Know which tools exists • Seen the tools in use • Something new and something useful • Go and experiment with the tools! @stalar staffan.larsen@oracle.com serviceability-dev@openjdk.java.net
Q&A @stalar staffan.larsen@oracle.com serviceability-dev@openjdk.java.net