CLIMODE Study: Formation of Eighteen Degree Water in North Atlantic
Explore the CLIMODE study (2005-2009) on the formation and dispersal of Eighteen Degree Water (EDW), a key water mass in the subtropical North Atlantic. Investigate processes like air-sea interaction, subduction, and circulation, crucial for understanding climate dynamics.

CLIMODE Study: Formation of Eighteen Degree Water in North Atlantic
E N D
Presentation Transcript
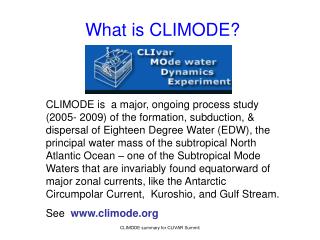
What is CLIMODE? CLIMODE is a major, ongoing process study (2005- 2009) of the formation, subduction, & dispersal of Eighteen Degree Water (EDW), the principal water mass of the subtropical North Atlantic Ocean – one of the Subtropical Mode Waters that are invariably found equatorward of major zonal currents, like the Antarctic Circumpolar Current, Kuroshio, and Gulf Stream. See www.climode.org CLIMODE summary for CLIVAR Summit
What are the unique processes involved? • EDW forms at the surface in late winter under the maximum of air-sea exchange in the N. Atlantic. The EDW outcrops along a 1500 km path paralleling the Gulf Stream. Key processes are: • Large air-sea exchange of sensible & latent heat over the separated western boundary current • Expected large lateral buoyancy fluxes across baroclinic flow in the ML during winter cooling CLIMODE summary for CLIVAR Summit
CLIMODE Themes • The scientific themes of CLIMODE are focused in 4 areas, with tools planned for each in [ … ]: • Air Sea Interaction [buoys, ships, radiosondes, satellites] • Eddies and Mixing [SeaSoar/ADCP, m-struct., spar, drifters] • Subduction & Circulation [moorings, floats, drifters] • Modeling of above [GFD high resolution, Mesoscale BL meteorology, Basin-scale, eddy-permitting ocean – with synoptic, ‘actual’ forcing] CLIMODE summary for CLIVAR Summit
CLIMODE Cruises CLIMODE summary for CLIVAR Summit
CLIMODE-2, AT013, Weather One of our goals for the first winter CLIMODE cruise was to have the ASIS spar deployed and be working during a cold air outbreak, with strong, cold, northerly winds. Our cruise began with bad weather, but winds were out of the south & we were still in cold water. However, on 26-28 Jan 2006, we got our wish! According to Jim Edson, latent and sensible heat losses during the cold air event totaled 700 & 300 W/m2, respectively. CLIMODE summary for CLIVAR Summit
Surface Buoy Observations In CLIMODE a surface meteorological buoy was deployed by BobWeller from Nov. 2005 – Feb. 2007 in the core of the mean Gulf Stream for the first time. Direct covariance flux estimates of momentum and heat are being made in addition to standard met. sensors. Note the cold air outbreaks in the buoy record for the winter of 2006. CLIMODE summary for CLIVAR Summit
Eta Model Comparisons for Winter 2006 • Model - Data comparisons show that simulated state variables and velocities are very close to observations, except moisture (RH) • Coarse resolution SST variability is not well-correlated with observations, but mean value is within 2-3 oC • Latent and Sensible heat fluxes are very good except when conditions are changing rapidly. Model tends to underestimate variability. • Model consistently underestimates solar shortwave flux, suggesting cloud cover errors CLIMODE summary for CLIVAR Summit
Winter cruise summaries • 2 week winter cruise in 2006 on R/V Atlantis provided initial data for planning • 6 week winter cruise in 2007 on R/V Knorr just completed • Both were highly successfull, observed large air-sea exchange and in the latter, the formation of new subtropical mode water (18oC Water) CLIMODE summary for CLIVAR Summit
8-9 March 2007 High HF Event Largest net heat loss observed from the Knorr (1300 w/m2) occurred on 8-9 March 2007. Here is a regional map of SST – Air Temp difference, with SST contours of the 17.5 & 18.5 oC isotherms during cold air outbreak on 9 March. Note how large DT can be found over the warm core of the GS and over its northward meanders. The Knorr SeaSoar on 8-9 March survey is shown by the white lines CLIMODE summary for CLIVAR Summit
Max Heat Flux -3 ? Radiosonde from 2300Z on 8 March CLIMODE summary for CLIVAR Summit
Recovering the surface flux buoy During the recovery of the buoy (above) and its instrumentation on 9 February, the Knorr experienced rain, sleet, hail, snow, and a visit by a waterspout (right, photo by Al Plueddemann): something one might expect to see in the tropics during the summer rather than amidst sea smoke in the winter N. Atlantic. CLIMODE summary for CLIVAR Summit
EDW, was it formed in the late winter of 2007? Yes! Of the CTD stations on Leg 2,one of the deepest layers of newly ventilated EDW was found at station 48, just south of the Gulf Stream (see white arrow at left). The ML depth (right) was about 500m at this station. CLIMODE summary for CLIVAR Summit
CLIMODE Status • CLIMODE more than half way into its field program • Our main winter cruise (6 wks) was just completed in Feb/Mar 2007 • CLIMODE will work to consolidate all critical scientific data & information in the next 2 years • There is no synthesis funding for CLIMODE – this must be proposed in ca. 2 years time once initial results are analyzed & submitted for publication CLIMODE summary for CLIVAR Summit
CLIMODE is a major process study of CLIVAR These slides were selected to focus on Air-Sea Interaction since this aspect of CLIMODE overlaps with the CLIVAR Working Group on mid-latitude, air-sea coupling over western boundary currents CLIMODE summary for CLIVAR Summit
Precip & Evap Compared While the winter months NCEP Evaporation (left) may be of questionable absolute accuracy, one can see enhanced Evaporation over the Gulf Stream off N. Carolina with increased CMAP Precipitation (middle) somewhat ‘downstream’ along the storm track, suggesting a rapid but not instantaneous atmospheric response, a decaying E-P signal (right), and efficient ‘recycling’ of water in the region. Units for both are mm/day. CLIMODE summary for CLIVAR Summit
Storm Track • TheMeridional QuikSCAT & ECMWF wind stress variance (from K. Kelly) can be used as a proxy for cyclone activity. One sees a clear maximum along Gulf Stream path (north wall in black), suggesting the storm track location and Gulf Stream path are closely coupled; this is especially clear for QuickSCAT. • Similar for major current systems (Nakamura et al., 2004) • Gulf Stream currents evident in QuikSCAT winds (Chelton et al., 2004) CLIMODE summary for CLIVAR Summit
CLIMODE-2, AT013, Meteorology Meteorological high resolution forecasts from NCEP (ETA) were provided by Samelson & Skyllingstad to us during the cruise. These helped us plan future work and gave us a better picture of current weather than typical radio broadcasts. Above is a sequence through the cold air outbreak of 26-27 January 2006 [air temp, sea level pressure, and winds] with locations of CTD stations made from the R/V Atlantis. CLIMODE summary for CLIVAR Summit
CLIMODE-2, AT013, Meteorology Meteorological high resolution forecasts from NCEP (ETA) were provided by Samelson & Skyllingstad to us during the cruise. These helped us plan future work and gave us a better picture of current weather than typical radio broadcasts. Above is a sequence through the cold air outbreak of 26-27 January 2006 [air temp, sea level pressure, and winds] with locations of CTD stations made from the Atlantis. CLIMODE summary for CLIVAR Summit
CLIMODE-2, AT013, Meteorology Meteorological high resolution forecasts from NCEP (ETA) were provided by Samelson & Skyllingstad to us during the cruise. These helped us plan future work and gave us a better picture of current weather than typical radio broadcasts. Above is a sequence through the cold air outbreak of 26-27 January 2006 [air temp, sea level pressure, and winds] with locations of CTD stations made from the Atlantis. CLIMODE summary for CLIVAR Summit
NCEP Eta Model • Hydrostatic 12 km resolution, 60 levels in the vertical with model top at 25 hPa, output every 3 hours from each 00 UTC simulation day • Horizontal grid, Arakawa “E”, velocities staggered from T,mass • SST 1/2o resolution from Navy analysis • Mellor-Yamada 2.5 Turbulence Closure • Analysis grid - 32 km (#221) • Boundaries from global spectralmodel CLIMODE summary for CLIVAR Summit
Future Model/data Directions • New NAM simulations (winter 2007) use the Weather Research and Forecasting (WRF) model. Comparisons will be repeated with this model and 2007 winter cruise data. • New SST resolution is 1/12 degree • We plan to conduct sensitivity experiments with COAMPS to examine how SST variations affect surface wind stress and surface fluxes, and modulate storm intensity. CLIMODE summary for CLIVAR Summit
Cruise Goals CLIMODE-4, 2007 Knorr • Deploy drifters in GS, floats in EDW • Deploy/recover ASIS/FILIS, EM-Apex to collect Lagrangian time-series, study of air-sea exchange & lateral mixing • CTDs -large-synoptic scale variability of water masses, EDW properties (PV, O2, CO2, Nuts., etc.) • SeaSoar – mesoscale structure of GS front, mixing/formation/modification of EDW in GS • Air-Sea Flux – estimate and directly calculate air-sea exchange during strong cooling • Atmospheric profiling – vertical/horizontal structure of lower atmosphere using Doppler radar, radiosondes • Microstructure – measure turbulence in Ocean during strong cooling • “Escape” from Cape Cod for the winter CLIMODE summary for CLIVAR Summit
Knorr’s bow mast & Met sensors Jungle Jim Edson replacing faulty sensor while at sea on Leg 2, March 2007. CLIMODE summary for CLIVAR Summit
Max Heat Flux Event During the period of most extensive heat exchange (on Leg 2, surprisingly) between mid-day on 8 March and mid-day on 9 March, the airflow was out of the WNW and the ship was doing a SeaSoar survey (right) in the Gulf Stream. The airflow was approximately parallel to the surface velocity of the ocean. In the following, we will show the underway SST/air temp data, and plots using the NAM model output during this ca. 1 day period. Note the oscillations in flux at the left. These can be traced to the SST changes of the Gulf Stream. CLIMODE summary for CLIVAR Summit
8-9 March High HF Event - 1 Regional map of SST, surface geostrophic flow, and ship’s track for SeaSoar survey of Knorr made during the cold air outbreak on 8 March. Note the areas of EDW outcropping between the two black SST contours of 17.5, 18.5 oC CLIMODE summary for CLIVAR Summit
8-9 March High HF Event – 2a Regional map of air temperature, sea level pressure and wind velocities from NCEP/NCAR’s WRF-NAM mesoscale model during the cold air outbreak on 8 March, 0000Z. Note the low developing over the GS near Hatteras CLIMODE summary for CLIVAR Summit
8-9 March High HF Event – 2b Regional map of air temperature, sea level pressure and wind velocities from NCEP/NCAR’s WRF-NAM mesoscale model during the cold air outbreak on 8 March, 1200Z. Note the low has developed over our location and is now “downstream”. CLIMODE summary for CLIVAR Summit
8-9 March High HF Event – 2c Regional map of air temperature, sea level pressure and wind velocities from NCEP/NCAR’s WRF-NAM mesoscale model during the cold air outbreak on 9 March, 0000Z. The low has shifted northward & moved off the map. This is the period of largest net air-sea heat flux from Knorr. CLIMODE summary for CLIVAR Summit
Max Heat Flux – up close SST (blue), Tair (red), and SST-Tair (black dashed) during the SeaSoar survey. The three periods of large heat flux correspond to the periods of high DT, which corresponds to the passage over the warm-core of the Gulf Stream. Note how the air temperature tracked changes in the SST as the ship passed from the warm to cold side of the Gulf Stream (blue arrow). Surface winds speeds reached a max of 20 m/s within this period. CLIMODE summary for CLIVAR Summit
Max Heat Flux – up close -2 A preliminary examination was made of the five radiosondes released at the sites of the red asterixes during part of the survey. SST with ¼ deg spatial resolution does not capture the true situation encountered by the Knorr & evident in the underway SST. From these sondes, we can see major disruptions of the atmosphere over the warmest waters, extending up into the mid-troposphere. CLIMODE summary for CLIVAR Summit
What are the likely benefits to CLIVAR? • Improved parameterization of lateral process in the mixed layer for climate models • Improved air-sea fluxes parameterization in regions of high winds and large latent heat loss [in contrast to TOGA-COARE] • Better understanding of MODE Water processes for the global ocean where MODE Waters are inevitably found equatorward of strong currents • Improved understanding of the mid-latitude air-sea coupling CLIMODE summary for CLIVAR Summit