Download
1 / 37
380 likes | 449 Vues
Understand the necessity of hazard maps in the PFRA process to assess floods, their impacts on various aspects, and identify potential risks. Guidelines are provided for flood hazard information, risk assessment, and indicators, with consideration for climate change effects. Proposed principles and strategies assist in mapping floodplains accurately and efficiently for further investigations and management plans.

E N D
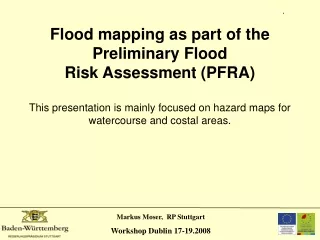
Flood mapping as part of the Preliminary Flood Risk Assessment (PFRA) This presentation is mainly focused on hazard maps for watercourse and costal areas.
The assessment shall include a description of the floods which have occurred in the past – and which might occurre again - and which had significant adverse impacts on: • human health, • the environment, • cultural heritage • economic activity • The floods shall be described, including their flood extent and conveyance routes. • The adverse impacts shall be assessed. This might be a very high – not necessary ? - claim
For the PFRA data to flood hazard and to the potential risks (risk indicators) are needed. For the PFRA is to use easy available or readily derivable information, such as records and studies on long term developments. For that reason: The aim is to show - with a simple procedure - where further investigations (hazard- and risk- maps) and building on that further actions (management plans) are needed and not to make these investigations.
For using hazard maps in the PFRA a first basic definition is very important. Two concepts to identify the areas with potential risk in the PFRA are under discussion.
Only parts of the watercourse - with high existing potential risk - shall be identified in the PFRA, and further investigations and actions like maps and management plans shall be done. - nonstructural initiatives - especially the spatial planning - will be not part of the management plan
watercourse or at least a large part of it may cause flood with potential risk without taking into account how high the actual potential risk is. - Historical and existing maps always show the whole watercourse
Proposed Principles for the PFRA: • Information on flood hazard: • Two kinds of flood hazard information can be distinguished: • Descriptions of historical flood events. There exist mostly good – usually textual - descriptions of watercourses with flood hazard and of the caused damages. A description of the flood extent is mainly only available for large rivers. • Flood hazard maps – based on hydraulic calculations – which represent flood extent and, if necessary, the depth of water for different statistic scenarios. • For a flood risk assessment the flood extent is necessary only in very plane and wide valley locations. For the PFRA a rough estimation of the areas at significant risk can take place without the knowledge of the exact flood extent at the most water bodies.
Proposed Principles for the PFRA: Assessment: No assessment is needed, when it is evident, that for a watercourse or an area a potential significant risk exists. • The watercourse is part of a conception of a man-made flood defence which is planned or already realised. • Hazard maps are planned or already realised. • There are clear descriptions of past floods and damages. An Assessment has to be done if it is known that floods may occur but no reports about damages are known.
Proposed Principles for the PFRA: Risk indicators: The risk indicators are mostly located in areas away from the watercourse. In principal two kinds of risk indicators information for the PFRA can be distinguished: • Information for endangered certain spots like industries (Annex I to Council Directive 96/61/EC of 24 September 1996), cultural heritage, very important economic locations. These risk indicator is clearly located and can easily be presented in the GIS. • Information for endangered areas like the impact on human health (number of inhabitants), economic activity. The area of the risk indicators can be located in the GIS (Corinne) but the assessment - number of people and endangered objects can only be done in a detailed analysis if the hazard maps are existent.
Proposed Principles for the PFRA: Climate change: Information about climate change can only be used in a general way. For each RBD/UoM it can be shown if floods higher than in the past have to be taken into account. If possible a qualitative assessment, e.g. in %, could be used.
Hazard maps in the Reporting of the PFRA: Problems by using the existing hazard maps - especially the historical flood maps - to show the exact flood plains in the PFRA: • In many cases they will be different to the flood plains in the hazard maps (Art 6 No. 3 and 4) because of the differing and partly poor quality of the available or readily derivable information. • They are not assigned to one of the scenarios of Art 6 No. 3. In consequence the areas should be marked in the PFRA for further investigations (maps). • They are in various scales, partly very detailed and have to be transferred an interpreted.
Hazard maps in the Reporting of the PFRA: Possibilities: • Not to mark the “real” floodplain. • Alternatively • Mark a whole water body (Catchment) or the whole RBD/UoM and the parts of the corresponding watercourse/coast which causes the flood as well. • This would be conform with the procedure in some topics of the WFD. • Rough outline (polygon) of the area which will be part of the hazard mapping.
Other information for the reporting of the assessment (Art No.2) Basic data of the reporting (Art. 4 No. 2a)
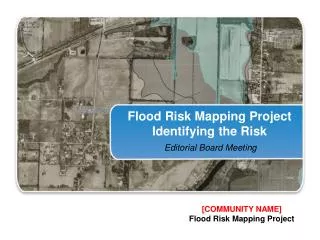
Proposed maps for the PFRA: • Proposted is a map with the following contents: • water body or RBD/UoM marked with potential risk or no potential risk • Topography • Watercourses with potential risk of flooding • Man-made flood defence infrastructure • Additional if needed: • Risk indicators/objects at risk (illustration with a symbol); • Possible: The level of actual risk along the watercourses marked with a colored belt in which “red” indicates significant actual risk, “green” no actual risk • The borders of the areas at significant risk and the flow paths not relaying to a actual watercourse.
RBD, Corinne (City, industry, agriculture), Topography Watercourse
RBD, Corinne (City, industry, agriculture), Topography Watercourse
RBD, Corinne (City, industry, agriculture), Topography Watercourse Watercourse with Flood risk
RBD, Corinne (City, industry, agriculture), Topography Watercourse Watercourse with Flood risk
RBD/ RBD excluded, Corinne (City, industry, agriculture), Topography Watercourse Watercourse with Flood risk
RBD/ RBD excluded, Corinne (City, industry, agriculture), Topography Watercourse Watercourse with Flood risk
RBD/RBD excluded, Corinne (City, industry, agriculture), Topography Watercourse Watercourse with Flood risk Man made Flood defence infrastructure
RBD/RBD excluded, Corinne (City, industry, agriculture), Topography Watercourse Watercourse with Flood risk Man made Flood defence infrastructure
RBD/RBD excluded, Corinne (City, industry, agriculture), Topography Watercourse Watercourse with Flood risk Man made Flood defence infrustructure Risk indicators industry
RBD/RBD excluded, Corinne (City, industry, agriculture), Topography Watercourse Watercourse with Flood risk Man made Flood defence infrastructure Risk indicators industry
Summary and Conclusion: The existing (flood) hazard maps of watercourses/coastlines are an important base to identify the further needs of investigations towards hazard and risk maps but the details are not needed in the PFRA. The maps in the PFRA should have the character of a draft and not be a pre-hazard mapping. As a standard in the PRFA the watercourses/coastlines should be mapped and only exceptionally the hazard maps are needed to show the details of the potential risk area.
Summary and Conclusion: • The reporting should be - especially with the basic data and the form - linked with the WFD and the WFD data should be used. • Detailed assessment of the measures for the management should not be done. • The assessment of the significant risk should not only be focused to the existing damage potential and the existing areas of population. The risk which will occur in case of changing the land use to economy activities or areas of population should be taken into account. • To divide a watercourse into many areas of potential risk is not purposeful and cannot be the base for a good risk management.
Open questions for discussion: • What flood mapping is required as an output of PFRA? • Which risk indicators should be illustrated in which way? • Should and if yes how should the outline of risk areas be traced? • what are the target groups of the PFRA and what are their particular needs? • How should the information / data be linked with the WFD? • Should, or can the identification of areas of potential significant risk be updated – and when?