Download
1 / 12
120 likes | 141 Vues
Investigating the impact of Saharan dust as CCN on tropical cyclone intensity through microphysical-dynamical interactions in an idealized simulation setup using the RAMS model. Results show non-monotonic responses, highlighting the importance of outer rainbands in TC intensification. The study suggests that higher concentrations of GCCN may dampen CCN effects, affecting precipitation and convective processes. Further research using a new sea salt aerosol model is recommended for realistic GCCN distribution.

E N D
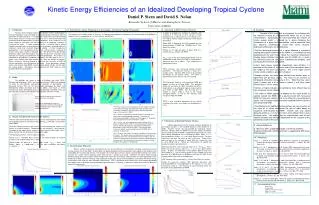
Microphysical-dynamical interactions in an idealized tropical cyclone simulation Stephen R. Herbener and William R. Cotton Colorado State University, Fort Collins, Colorado
Outline • Introduction • Simulation Setup • Experiment Design • Results • Summary
Introduction • Computer models are used to help gain insight into the complex and difficult to measure physical processes taking place inside storms • One line of investigation, Zhang et. al. (2007), Zhang (2008) and Zhang et. al. (2009), studied the impact of Saharan dust acting as CCN on Atlantic tropical cyclones • Found a general trend of decreasing storm intensity with increasing concentrations of CCN as one would expect, but the relationship was not monotonic
Introduction • This work investigates the following hypothesis presented to explain the non-monotonic response of the TC intensity to the CCN concentration in the Zhang studies • In the outer rainbands: • ↑ CCN concentration → • ↓ collision/coalescence → • ↑ supercooled water transported aloft → • ↑ convection (release of latent heat of freezing) → • ↑ precipitation, evaporative cooling → • ↑ low level areal cold pool formation • The increase in cold pool coverage in the outer rainband region blocks the flow of energy into the storm core inhibiting the intensification of the TC • However, the amount of suppression of the strength of the TC depends on the timing between the transport of CCN to the outer rainbands and the intensity and lifecycle stage of the outer rainband convection. • The outer rainband convection needs to be strong in order for the transport of supercooled liquid water aloft to take place
Simulation Setup • Regional Atmospheric Modeling System (RAMS) • Triple two-way interactive nested grid • Grid size: 1920km, 600km, 300km (grids 1,2,3) • Grid spacing: 24km, 6km, 1.5km (grids 1,2,3) • Time steps: 60s, 20s, 10s (grids 1,2,3) • Initialization • Axisymmetric vortex • Warm bubble to initiate convection • f-plane centered on 15N, 40W
Experiment Design • Zhang “CCN From Boundaries” experiment • Simulating TC entering the SAL • Five CCN concentrations: 100, 500, 1000, 1500, 2000 cc-1 • One initial simulation to “spin-up” the TC • 0 to 36hrs • CCN concentration set to “background”: 100 cc-1 • Five experimental simulations to test sensitivity to CCN concentration • 36 to 72hrs • One for each test CCN concentration amount • Two sets of experiments • GON: GCCN set to horizontally homogeneous “background” profile • GOFF: GCCN set to very low (essentially off) concentration everywhere
Storm Intensity • HZ (Zhang, 2008): Left, GON: Middle, GOFF: Right • Coverage metric • Destructive potential of storm • Based on area of surface wind speed >= hurricane force • Non-monotonic response of TC intensity to CCN concentration • Highlighted trace is R1500 (1500 cc-1) simulation 67hrs
Vertical Velocity, Temperature at 67hrs in outer rainband region (r = 175-210km) • GON lacks significant downdrafts • GOFF has significant downdrafts and the associated low level cooling • GOFF also has significant high level updrafts indicating enhanced convection GON GOFF w CFAD (%) Azimuth. Avg. Temp (C)
Supercooled and warm liquid water at 67hrs • GOFF has significantly greater amounts of supercooled liquid water in the outer rainband region • GOFF has reduced amounts of warm liquid water in rainband region GON GOFF Supercooled LWP Warm LWP
Summary • Data in this study are consistent with microphysical-dynamical aspects of proposed hypothesis • Haven’t yet worked out the timing aspect of the hypothesis between the introduction of CCN and the lifecycle stage of the outer rainband convection • Higher concentration of GCCN tends to dampen out effects of CCN • CCN creates narrow DSD with small size droplets • GCCN adds large droplets to the mix • CCN acting alone tends to inhibit warm rain process • GCCN/CCN acting together tend to enhance warm rain process • In real TC one would expect higher concentrations of GCCN in the storm interior with lower concentrations in the outer rainband region due to greater sea spray activity in the storm interior • New sea salt (spray) aerosol model very recently introduced into RAMS • Need to rerun this study’s experiment using the new sea salt model in order to get a more realistic distribution of GCCN across the TC
CCN Application Scheme • GOFF, R2000 simulation • CCN level applied to north boundary of grid3 • CCN level slowly ramped up from background (100 cc-1) to concentration being tested