Download
1 / 24
240 likes | 375 Vues
Using multispectral imagery to monitor vegetation change following flow restoration to the Lower Owens River, California. Lesley Bross - Portland State University lbross@pdx.edu August 1, 2014. Research question(s).

E N D
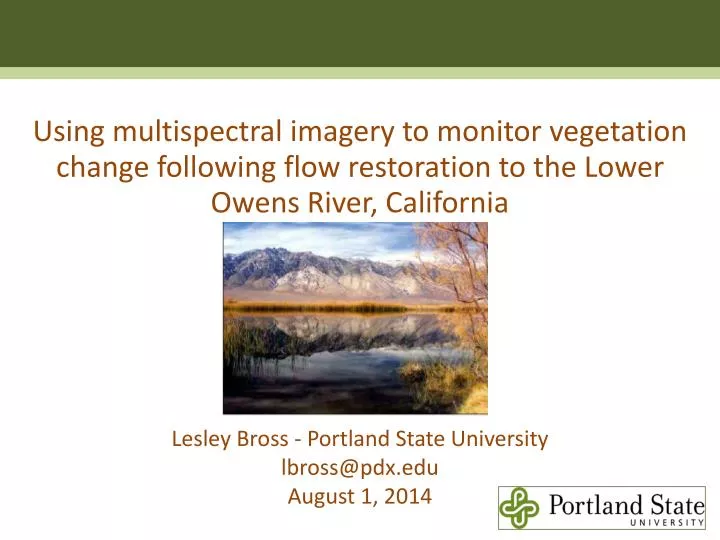
Using multispectral imagery to monitor vegetation change following flow restoration to the Lower Owens River, California Lesley Bross - Portland State Universitylbross@pdx.edu August 1, 2014
Research question(s) Can Landsat scenes be used to monitor riparian vegetation change following flow restoration to the Lower Owens River ? • Compare different change detection techniques • Calculate and analyze landscape pattern metrics • Compare results from study plots with different vegetation communities Source: OVC 2008
Riparian zones • Interface between terrestrial and aquatic ecosystems • Diverse habitat = relatively high species richness • Provide important ecological functions • About 2% of original riparian land cover remains in western United States (Jones et al. 2008) Source: Ecosystem Sciences 2008B
Restoration efforts • River restoration projects are expensive (time and money) • Monitoring success with ground surveys is also costly • Is there an alternative? Source: Coffin 2013
Satellite multispectral imagery • Ground-truth data has limited spatial and temporal resolutions • Landsat images cover a large areas inexpensively • Unique landscape patterns are revealed at larger scale • Regularly scheduled satellite images can monitor landscape change • Archived remotely sensed data provides views of pre-restoration landscape
Owens River Watershed Source: Ecosystem Sciences 2008B
Lower Owens River Source: Risso 2007
Hydrologic history • 1913: First Los Angeles aqueduct opens • 1929: Tinemaha Dam completed • 1970: Second Los Angeles aqueduct opens • 1991: LADWP and Inyo County approve Long Term Water Agreement; EIR completed • 1997: Memorandum of Understanding • 2006: Base flow restored to Lower Owens
2008: Seasonal habitat flow Source: OVC 2008
NDVI • NDVI: Normalized Difference Vegetation Index represents greenness:((IR - R)/(IR + R)) * 100 + 100 • Ratio minimizes multiplicative noise from topographic factors (shadows, aspect) when comparing images Source: ESRI 2010
Landscape pattern metrics • Tool to explain effects of landscape patterns on biological processes and vice versa • Patch-corridor-matrix is a popular model for quantifying landscape change Source: Barnes 2000
Fragmentation and connectivity • Fragmentation: breaking up of land cover type into smaller, isolated plots • Connectivity: spatial continuity of land cover type across a landscape; How easy is it to move among patches? Source: Fahrig 2003
Which metrics to calculate? • Select metrics appropriate for scale and research question • Freeman et al. recommend: • percent of landscape occupied (per class) • number of patches • mean patch size • patch density • edge density • How did land cover patterns change between 2002 and 2009? Source: ESRI 2010
Plot 2: Vegetation maps Source: Ecosystem Sciences 2002, 2010 • Ground surveys conducted in 2001, 2002, and 2009 • Vegetation complexes reclassified to NLCD classes
Plot 3: Vegetation maps Source: Ecosystem Sciences 2002, 2010
Landsat multispectral imagery • Acquire Landsat images for summers of 2002 and 2009 • Source data for • Post-classification change detection • Image differencing (NDVI) Source: USGS 2014
#1: Post-classification change detection • Unsupervised classification => land cover map (5 NLCD classes) • Perform accuracy assessment using ground truth polygons • Accuracy = important! Every error in both classifications = error in final results • Collapse classes if needed • Analyze “from-to” maps (percent occupied)
Spatial pattern analysis • 2002 and 2009 land cover maps = input for pattern analysis • Class-level metrics for: forest, wetlands, and grasslands • Calculate: • number of patches • mean patch size • patch density • edge density • Plot mean patch size against density (connectivity) Source: Freeman et al. 2003
#2: NDVI image differencing • Preprocessing: atmospheric correction? • Calculate NDVI for both dates • Subtract 2009 NDVI from 2002 NDVI • Difference values indicate: • Direction of change (bare earth -> grasses) • Magnitude of change • Set threshold values for change (difficult) Source: ESRI 2010 2002 2009
Spatial pattern analysis (redux) • Determine NDVI threshold value indicating green vegetation • Use value to create data layers with vegetation/no-vegetation parcels • 2002 and 2009 data layers = input for pattern analysis • Calculate: • number of patches • mean patch size • patch density • edge density • Plot mean patch size against density (connectivity)
Anticipated outcomes • Evaluate two common change detection methods and report their benefits and limitations • Assess the usability of Landsat-derived vegetation maps for riparian (narrow) landscapes • Demonstrate an economical, repeatable process that can be used to monitor vegetation change following river rehabilitation efforts Source: Ecosystem Sciences 2008A
Timeline • Fall 2014: Literature review and technical tasks • Winter 2015: Write-up results • Spring 2015: Thesis presentation
References ArcGIS 10. 2010. ArcGIS 10 Help. Redlands, CA: Environmental Systems Research Institute (ESRI). Barnes, T. 2000. Landscape ecology and ecosystems management. Lexington, KY: University of Kentucky College of Agriculture. Available at http://www2.ca.uky.edu/agc/pubs/for/for76/for76.htm (last accessed 10 July 2014). Coffin, B. 2013. Hemlock Dam removal—Clearing a path for steelhead recovery in Trout Creek. Vancouver, WA: Salmon Recovery Conference. Available at: http://www.rco.wa.gov/documents/SalmonConference/presentations/TuesdayPMCoffin.pdf (last accessed 13 September 2013). Danskin, W. 1998. Evaluation of the hydrologic system and selected water-management alternatives in the Owens Valley, California. United States Geological Survey (USGS), Water-supply Paper 2370:1-175. Ecosystem Sciences. 2002. Lower Owens River Project Baseline polygons. Prepared for the site scale mapping component of the LORP Monitoring and Adaptive Management program. (Received from Timothy Maguire on April 21, 2014). Ecosystem Sciences. 2008A. Lower Owens River project 2008 annual monitoring draft report. Prepared for Los Angeles Department of Water and Power and Inyo County Water Department. Available at http://www.inyowater.org/projects/lorp/ (last accessed 10 July 2014). Ecosystem Sciences. 2008B. Lower Owens River Project Monitoring, Adaptive Management and Reporting Plan. Prepared for Los Angeles Department of Water and Power and Inyo County Water Department. Available at http://www.inyowater.org/projects/lorp/ (last accessed 12 June 2014).
References Ecosystem Sciences. 2010. Lower Owens River Project 2010 polygons. Prepared for the site scale mapping component of the LORP Monitoring and Adaptive Management program. (Received from Timothy Maguire on April 21, 2014). Fahrig, L. 2003. Effects of Habitat Fragmentation on Biodiversity. Annual Review of Ecology, Evolution, and Systematics 34(2003): 487-515. Freeman, R., E. Stanley, and M. Turner. 2003. Analysis and conservation implications of landscape change in the Wisconsin River floodplain, USA. Ecological Applications 13(2): 416-31. Jones, K., C. Edmonds, E. Slonecker, J. Wickham, A. Neale, T. Wade, K. Riiters, and W. Kepner. 2008. Detecting changes in riparian habitat conditions based on patterns of greenness change: A case study from the Upper San Pedro River Basin, USA. Ecological Indicators 8(1): 89-99. Naiman, R. and H. Decamps. 1997. The ecology of interfaces: riparian zones. Annual Review of Ecology & Systematics 1997(28):621-58. The Owens Valley Committee (OVC). 2008. Lower Owens River Project. Bishop, CA: OVC. Available at http://www.ovcweb.org/issues/lorp%20overview.html (last accessed 10 July 2014). Risso, D. 2007. Floodplain vegetation following over 80 years of intensive land use and de-watering: Lower Owens River, California. Master’s Thesis. Department of Fisheries and Wildlife, Oregon State University. Turner, M., Gardner, R., and R. O’Neill. 2001. Landscape ecology in theory and practice pattern and process. New York: Springer-Verlag. United States Geological Service (USGS). 2014. EarthExplorer. Washington D.C.: USGS. Available at http://earthexplorer.usgs.gov/ (last accessed 24 January 2014).