Download

1 / 17
180 likes | 350 Vues
A Probit Analysis Use of Financial Planners by U.S. Households Stephanie A. Elmerick, Catherine P. Monalto & Jonathon J.Fox By Cristina Bailey & Beverly Johnson. Agenda Probit Defined Probit Uses Limitations Example: Purpose & Variables Results & Analysis. Probit ~ Defined.

E N D
A Probit Analysis Use of Financial Planners by U.S. Households Stephanie A. Elmerick, Catherine P. Monalto & Jonathon J.Fox By Cristina Bailey & Beverly Johnson
Agenda ProbitDefined Probit Uses Limitations Example: Purpose & Variables Results & Analysis
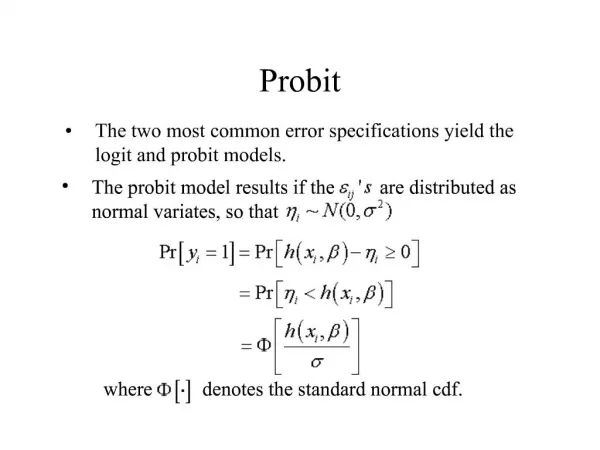
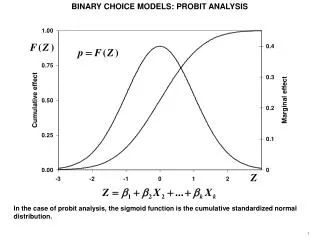
Probit ~ Defined • Introduced by Chester Bliss in 1934. • Type of regression model where the dependent variable can only take two values (0 or 1) • Many response variables are binary by nature (yes/no) • Ordinary least squares (OLS) regression has been shown to be inadequate when the dependent variable is discrete (Collett, 1991 and Agresti, 1990). Probit or logit analyses are more appropriate in this case. • Useful for making multiple comparisons & can model latent variables.
Probit ~ Defined • Most often estimated using maximum likelihood procedures. • Attempts to explain the relative effect of differing explanatory variables on the different outcomes. • Types: binary, multinomial, ordered, event, censoring & truncation • Set of choices must be finite, mutually exclusive, exhaustive
Probit ~ Uses • Statistics and econometrics • estimate several correlated binary outcomes jointly. • Social science problems • Legislator Votes: Aye/Nay • Involved in an Armed Conflict: Yes/No • Additional Uses • Wildlife (Algae Present: Yes/No) • Finance (Bankruptcy Filing: Yes/No) • Accounting (Financial Restatement: Yes/No) • Marketing (Customer purchase: Yes/No) • Management (Adopt Strategy: Yes/No) • Personal Financial Planning (Example coming up!)
Probit ~ Limitations • Limitations • Binary/Dichotomous Dependent Variable • Results sensitive to outliers • Requires more cases than OLS regression because of maximum likelihood estimation techniques
Example ~ Purpose To examine the characteristics of people who use financial planners by U.S. households using data from the 1998 Survey of Consumer Finances. • Public data set. • Data set has interviews from over 4,305 U.S. Households. • Detailed information on the financial resources and financial behavior of U.S. Households.
Example ~ Concepts & Variables Dependent Variables (Categories of Use) • Credit and Borrowing Advice Only • Saving and Investing Advice Only • Comprehensive Financial Advice Independent Variables (Socio-demographic Characteristics) • Age • Education • Race/Ethnicity • Marital Status • Household Size • Employment Status
Example ~ Concepts & Variables Independent Variable (Financial Characteristics) • Income • Net Worth • Financial Assets • Debt to Income Ratio
Example ~ Variable Creation *We want to start turning the raw variables in research variables; LIBNAME RESEARCH 'F:\Research I Sas'; *The following lines of code prepare the variables from scf to be used in statistical analysis; *These lines of code define categories for age; DATA AGE; SET RESEARCH.SCF1998IMP1; *age of household head, these are research variables; Age=X14; IF AGE LT 35 THEN AGECL=1; ELSE IF 35 LE AGE LT 45 THEN AGECL=2; ELSE IF 45 LE AGE LT 55 THEN AGECL=3; ELSE IF 55 LE AGE LT 65 THEN AGECL=4; ELSE IF AGE GE 65 THEN AGECL=5; ELSE AGECL=99; *Age of household head, these are statistical variables; IF AGECL=1 THEN UNDER35=1; ELSE UNDER35=0; IF AGECL=2 THEN AGE35_45=1; ELSE AGE35_45=0; IF AGECL=3 THEN AGE45_55=1; ELSE AGE45_55=0; IF AGECL=4 THEN AGE55_65=1; ELSE AGE55_65=0; IF AGECL=5 THEN OVER65=1; ELSE OVER65=0; KEEP AGE UNDER35 AGE35_45 AGE45_55 AGE55_65 OVER65; RUN;
Example ~ Descriptive Code *HOW TO MERGE HORIZONTAL VARIABLES TO FINAL DATASET; DATA RESEARCH.FINAL; MERGE HOUSESZ RACE AGE INCOME EDUCATION MARITAL EMPLOYMENT FINCLASS NETWORTH DEBT FINASSET NET1; RUN; *The following lines of code run descriptive data for tables 1&2; *This is for Finclass for tables 1&2; PROC FREQ DATA=RESEARCH.FINAL ; TABLES CREDIT INV CFP / chisq; WEIGHT WEIGHT; RUN; *This is for Age v Finclass for tables 1&2; PROC FREQ DATA=RESEARCH.FINAL ; TABLES UNDER35*CREDIT AGE35_45*CREDIT AGE45_55*CREDIT AGE55_65*CREDIT OVER65*CREDIT / chisq; WEIGHT WEIGHT; RUN; PROC FREQ DATA=RESEARCH.FINAL ; TABLES UNDER35*INV AGE35_45*INV AGE45_55*INV AGE55_65*INV OVER65*INV / chisq; WEIGHT WEIGHT; RUN; PROC FREQ DATA=RESEARCH.FINAL ; TABLES UNDER35*CFP AGE35_45*CFP AGE45_55*CFP AGE55_65*CFP OVER65*CFP / chisq; WEIGHT WEIGHT; RUN;
Results ~ Table 1 Socio-demographic Characteristics Descriptive Analysis
Example ~ Chi Square Test Code PROC MEANS DATA=RESEARCH.FINAL N MEDIAN MEAN; VAR AGE EDUC ;WEIGHT WEIGHT; RUN; PROC FREQ DATA=RESEARCH.FINAL; TABLES UNDER35 AGE35_45 AGE45_55 AGE55_65 OVER65 / chisq; WEIGHT WEIGHT; RUN; *The following lines of code run tables 3&4 by credit only for sociodemographic and financial characteristics; DATA CREDIT; SET RESEARCH.FINAL; IF CREDIT; RUN; PROC MEANS DATA=WORK.CREDIT N MEDIAN MEAN; VAR AGE EDUC ;WEIGHT weight; RUN; PROC MEANS DATA=WORK.CREDIT N MEDIAN MEAN; VAR INCOME NETWORTH FIN; WEIGHT WEIGHT; RUN; PROC FREQ DATA=CREDIT; TABLES UNDER35*CREDIT AGE35_45*CREDIT AGE45_55*CREDIT AGE55_65*CREDIT OVER65*CREDIT /CHISQ; WEIGHT WEIGHT; RUN;
Results ~ Table 3 Socio-demographic Characteristic Chi-square tests (Bivariate Analysis)
Example ~ Probit Regression Code PROC IMPORT OUT=FINAL DATAFILE="I:\RESEARCH I Sas\FINALV1.XLS" DBMS=EXCEL REPLACE; RUN; PROC PROBIT DATA=FINAL Model CREDIT = AGE35_45 AGE45_55 AGE55_65 OVER65 COLLEGE SCOLL HS GRAD BLACK HISPANIC OTHER SINGLE_M SINGLE_F HH2-HH7 S_EMP N_EMP_RET INC2-INC4 WORTH2-WORTH4 FIN2-FIN4 RATIO2-RATIO4/NOINT; Run;