Download

1 / 40
400 likes | 416 Vues
Learn about the current financial strength of U.S. agriculture, risk management goals, crop insurance, and marketing strategies for the upcoming season. Understand the role of revenue protection, seasonal price trends, and new farm programs.

E N D
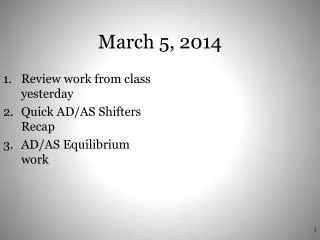
March 5, 2014 Steven D. Johnson Farm & Ag Business Management Specialist (515) 957-5790sdjohns@iastate.edu www.extension.iastate.edu/polk/farm-management
Presentation Objectives Understand the Current Financial Strength of U.S. Agriculture Provide Risk Management Goals & Strategies Highlight U.S. Weather Outlook/Crop Insurance Review the Role of Revenue Protection to protect Crop Yields and Prices Utilize Seasonal Price Trends and tie Pre-Harvest Marketing to Insurance Bushels Conceptualize the New Farm Program and Commodity Crop Enrollment Choices Compare Potential 2014 Payments for County ARC, Farm ARC and PLC Programs Highlight Crop Risk Management Web Sites.
U.S. Net Farm Income Trends * - Forecast Source: USDA Economic Research Service, November 2013
U.S. Farm Debt-to-Asset Ratio * - Forecast Source: USDA Economic Research Service, November 2013
Fig 10 2014 U.S. Planted Acre Forecast Source: USDA World Outlook Board, February 2014
Crop Prices to Decline from Record Highs Fig 11 Wheat, corn and soybeans in dollars per bushel; rice in dollars per hundredweight; cotton in cents per pound. Numbers in red denote record levels. Source: USDA NASS, WASDE and World Outlook Board, February 2014
Crop Risk Management Goals & Strategies Learn to Use a Variety of Crop Marketing Tools; Implement Written Plans Utilize Revenue Crop Insurance Coverage, Pre-Harvest Marketing & Enrolling in ARC Reconsider 2015 Fixed Farm Leases; Consider Flexible Cash Leases Know Your Costs; Be Shrewd in Making Input Decisions Invest Wisely in Operational Excellence: Be a Low-Cost Producer Source: Johnson, ISU Extension, March 2014
Iowa Land Value & Cash Rental Rate Trends 2013 Averages Cash Rent: $270/A Land Value: $8716/A 3.10% Source: Duffy & Edwards, ISU Extension Economics, May/December 2013
El Niño (ENSO) Neutral until Spring Spring/Summer Forecast: The tropical Pacific Ocean subsurface has warmed substantially in recent weeks, which is likely to result in a warming of the ocean surface in the coming months. The tropical Pacific Ocean with temperatures approaching or exceeding El Niño thresholds by the summer months. Source: www.bom.gov.au/climate/enso/, March 11, 2014
Elwynn Taylor’s 2014 Risk Wheel La Niña Summer = 70% risk of below trendline corn yield Neutral Summer = 53% risk of above trendline corn yield El Niño Summer = 70% risk of above trendline corn yield Source: Taylor, ISU Extension Climatologist, February 2014
Corn Insurance Coverage (2013) Revenue Protection = 86% of Insured Acres (Illinois) vs. 95% (Iowa) Iowa Illinois Source: USDA Risk Management Agency, October 2013
Soybean Insurance Coverage (2013) Revenue Protection = 87% of Insured Acres (Illinois) vs. 95% (Iowa) Iowa Illinois Source: USDA Risk Management Agency, October 2013
Marketing Revenue Protection (RP) Guaranteed Insurance Bushels Source: Johnson, ISU Extension, February 2014
2014 Crop Insurance Decisions Unit Coverage? (Basic, Optional or Enterprise)? Deductible? Trend-Adjusted APH Yield Endorsement ? Revenue Protection – RP (65%-85% Levels) Supplemental: Hail, Wind & Green Snap, Total Weather or Varying Projected Price? 2014 Projected Prices: Corn = $4.62/bu, Soybeans= $11.36/bu Source: Johnson, ISU Extension, March 2014
Delivery of Corn Bushels with Revenue Protection (RP) Marketing Strategy • Pre-Harvest Sell for Delivery up to 153 Bu/A • Price Guarantee is Higher of the Projected Price vs. Harvest Price • Slight Basis Risk • Must Plant the Crop (Prevented Planting = 60%) Deductible 15% = 27 Bu/A RP @ 85% Level of Coverage 153 Bu/A Guarantee X $4.62/bu Projected Price 180 Bu/A Actual Production History (APH) = $707/A Revenue Guarantee Source: Johnson, ISU Extension, March 2014
Corn Insurance Prices vs. Seasonal Highs Source: USDA Risk Management Agency & CME Group, Nov. 2013
December Corn Futures Seasonals 2003-07 Average High $2.92 2008-12 Average High $5.90 2013 High $5.93 Source: www.cmegroup.com, October 2013
Soybean Insurance Prices vs. Seasonal Highs Source: USDA Risk Management Agency & CME Group, Nov. 2013
November Soybean Futures Seasonals 2013 Average High $12.66 2003-07 Average High $6.10 2008-12 Average High $11.14 Source: www.cmegroup.com, October 2013
Strategies for Marketing 2014 Crop Expect New Crop futures prices to rally with spring planting uncertainty (Seasonals): • Consider forward contracts/HTAs (Delivery) for Guaranteed Insurance Bushels • Futures Hedges (Non-Delivery) Bushels • Buy Put Options (Non-Delivery) Bushels Sell Bushels to meet Fall/Winter Cash Flow: • Consider new-crop sales for both corn and soybeans (use spring/summer month rallies) • Avoid long-term commercial storage. Source: Johnson, ISU Extension, March 2014
Farm Bill 10-year Baseline (FY 2014 to FY 2023) Source: The Agricultural Act of 2014, February 2014
New Farm Program Commodity Crop Choices (5 years: 2014-18) OR Marketing Loan National Rates: $1.95/bu Corn $5.00/bu Soybeans Source: The Agricultural Act of 2014, February 2014
New 5-Year Farm Program Implementation Plan Proposed Commodity Crop Rules and Regulations Released Conservation Programs (EQIP & CSP) Agricultural Act of 2014 Livestock Disaster Assistance Program Commodity Crop Program Education Commodity Crop Program Sign-up 2014 2015 JAN FEB MAR APR MAY JUN JUL AUG SEP OCT NOV DEC JAN FEB Source: Secretary of Ag Vilsack, February 28, 2014
FSA Commodity Crop Enrollment Decisions Base acres can be reallocated using 2009-12, but can’t exceed farm’s total historic base. County ARC 85% of base acres, Revenue Trigger = 5-yr. OA county yields X 5-yr. OA MYA price (Estimated Price: $5.30/bu corn & $12.17/bu soybeans) Enrollment at FSA: Summer/Fall -Base and/or Yield updates; Winter - ARC or PLC sign-up. Farm ARC 65% of base acres, Revenue Trigger = 5-yr. OA farm yields X 5-yr. OA MYA price (If elected, revenue summed across all commodity crops on farm. One-time choice (irrevocable) by FSA farm number (need both operator and landlord signatures). If a farm fails to enroll in either ARC or PLC in 2014, then PLC serves at the default for 2015 through 2018. PLC 85% of base acres, Price only Trigger = $3.70/bu corn, $8.40/bu soybean reference prices Source: www.farmdocdaily.illinois.edu, Feb. 12, 2014
Reallocating Base AcreageFarm Historic: 100 Total Base Acres Corn 50 Acres Soybeans 50 Acres Source: www.farmdocdaily.illinois.edu, March 6, 2014
Base Acreage ReallocationExample #1 Source: www.farmdocdaily.illinois.edu, March 6, 2014
Reallocation Example #1Can be requested at ARC/PLC Sign-up Corn 65 Acres Soybeans 35 Acres Source: www.farmdocdaily.illinois.edu, March 6, 2014
Base Acreage ReallocationExample #2 Source: www.farmdocdaily.illinois.edu, March 6, 2014
Reallocation Example #2Can be requested at ARC/PLC Sign-up Corn 75 Acres Soybeans 25 Acres Source: www.farmdocdaily.illinois.edu, March 6, 2014
Comparing ARC Average Prices vs. PLC Reference Prices Agriculture Risk Coverage (ARC) YearCornSoybeans 2009$3.55$ 9.59 2010 $5.18 $11.30 2011 $6.22 $12.50 2012$6.89$14.40 2013 $4.50 $12.70 ARC 5-yr. OA MYA Prices Corn = $5.30/bu. Soybeans = $12.17/bu. Price Loss Coverage (PLC) Corn = $3.70/bu. Soybeans = $8.40/bu. Source: www.farmdocdaily.illinois.edu, Feb. 20, 2014
County ARC: Calculating Corn Revenue Source: www.farmdocdaily.illinois.edu, Feb. 20, 2014
County ARC: 2014 Corn Potential Payment Source: www.farmdocdaily.illinois.edu, Feb. 20, 2014
County ARC: Calculating Soybean Revenue Source: www.farmdocdaily.illinois.edu, Feb. 20, 2014
County ARC: 2014 Soybean Potential Payment Source: www.farmdocdaily.illinois.edu, Feb. 20, 2014
Farm ARC: 2014 Corn & Soybean Combined Revenue Guarantee Source: www.farmdocdaily.illinois.edu, Feb. 20, 2014
Farm ARC: 2014 Corn & Soybean Combined Potential Payment Source: www.farmdocdaily.illinois.edu, Feb. 20, 2014
PLC: Corn 2014 Payment Potential Source: www.farmdocdaily.illinois.edu, Feb. 20, 2014
PLC: Soybean 2014 Payment Potential Source: www.farmdocdaily.illinois.edu, Feb. 20, 2014
Crop Risk Management Web Sites • Crop Risk Management - ISU Polk County (Farmland Owners Newsletter, Webcasts and Videos, Updates on Crop Marketing Strategies, Government Farm Programs & Farmland Leasing) www.extension.iastate.edu/polk/farm-management • Farm Doc – U of IL Extension Economics (Daily e-Newsletter, FAST Tools, Newsletters, Publications) www.farmdoc.illinois.edu • Ag Manager – Kansas State Extension Economics www.agmanager.info • Purdue Extension Economics www.agecon.purdue.edu/extension • Ag Decision Maker – ISU Extension (Iowa Commodity Challenge Curriculum, Monthly e-Newsletter, Decision Tools, Newsletters, Publications, Voiced Media) www.extension.iastate.edu/agdm Source: Johnson, ISU Extension, March 2014