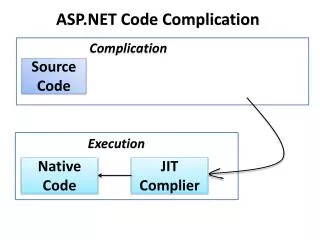
Lunar libration a complication
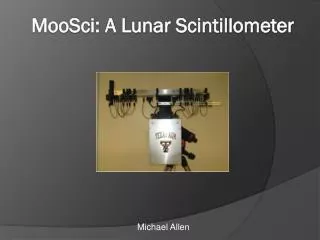
This study examines the lunar libration phenomenon's impact on understanding Earth's climate using spectroscopy data. It delves into albedo variations, global change monitoring, and the Earthshine effect. The research focuses on precise observations and simulations to decipher climate patterns and atmospheric composition.
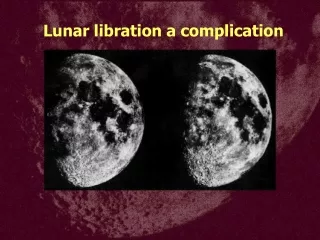

Lunar libration a complication
E N D
Presentation Transcript
Hourly variation Roughly 1/3 coverage, independent of lunar phase
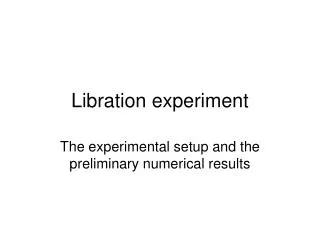
Seasonal variations Observations Simulation
Spectroscopy an intriguing possibility • Hi-res spectroscopy has revealed much about other planets • Few, if any, whole earth visible spectra • LEO satellite spectrometers available • Earthshine spectrum • Earthshine passes 3 times through the atmosphere, moonlight once • Line depths, shapes, and ratios might provide global information on molecular amounts, temperatures, and profiles
Palomar 60” echellespectrometer MS ES Sky ES-Sky/MS Solar hydrogen Atmospheric oxygen
Some words on programmatics • Present team • SEK, Phil Goode (NJIT/BBSO) • Two postdocs (PRC, Russia) • One tech, one grad student (US) • Funding at $100k/yr (DOE, NASA) • Two additional stations planned for continuous coverage • Crimea, Hunan
Three-pronged attack on the problem • Computational modeling • Conservation of mass, momentum, energy • Grid in longitude, latitude, altitude • Process studies • Seb-grid scale parameterizations • Coupling of the various componets • Monitoring (what is the climate doing?)
Observations are essential to understanding global change • Monitoring and process studies are complementary, but equally important • The monitoring requirements are stringent • Regional or global converate to average spatial variability • Long time series to average temporal variability, identify modes, and detect gradual changes • High precision to detect small shifts • But the Earth is big, the modern record is short, and precision is difficult from any platform
The Moon offers a “new” method for monitoring the Earth • Earthshine visible on the lunar disk can reflect the changing climate • Intensity, Color, Spectrum • Outline • Albedo and climate • Earthshin • Photometry • Historical measurements (1927-1934; 1940-1960) • The present program (Caltech, NJIT)
The albedo sets the input to the climate heat engine • Shortware input (visible, 0.5 mm, 6000 K) • Longwave output (IR, 15 mm, 255 K) • Global and seasonal average is A ~ 0.30
The earth’s albedo is highly variable • Local albedo depends upon: • Surface type • Solar zenith angle (time of day) • Meteorology (clouds) • The global albedo varies with the seasons • North/South land symmetry • Snow/ice cover
The climate is very sensitive to A • Te=255K is the temperature at 6 km • Atmosphere transparent to 15 mm radiation • Not the surface temperature (287 K) • Linearization of the power balance gives dT/DA~-1.5K/0.01 • Similar to that observed in models • Real data are sparse and ambiguous • Greenhouse effect on A uncertain • Doubling CO2 will likely increase T by 1.5-4.5K • Clouds increase (type changes) but snow/ice decrease
Satellites are the standard way to measure the albedo • Low-earth orbit (few 100 km) • Observe one spot (10 km) at at time; average over pixels • Incomplete space/time converate • Expensive • Tough to calibrate at a fraction of a percent • Subject to failures (none now working) • Complex scene models required to analyze data • Precision of about 0.7%
Earthshine is reflected from the earth to illuminate the moon • Ghostly glow of the dark part of the lunar disk • E/S ~Albedo X geometry X moon properties • Intensity varies during the month • Largest when phase ~pi (full earth, crescent moon) • Smallest when phase ~0 (full moon, crescent earth) • Measure by A. Danjon (1927-34) and J. Dubois (1940-1960)