1 / 5

QTL colour coded by trait category as follows: Grain - red Leaf – dark blue Maturity - yellow

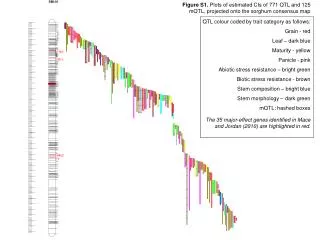
Figure S1. Plots of estimated CIs of 771 QTL and 125 mQTL, projected onto the sorghum consensus map. QTL colour coded by trait category as follows: Grain - red Leaf – dark blue Maturity - yellow Panicle - pink Abiotic stress resistance – bright green Biotic stress resistance - brown

Télécharger la présentation

QTL colour coded by trait category as follows: Grain - red Leaf – dark blue Maturity - yellow

An Image/Link below is provided (as is) to download presentation Download Policy: Content on the Website is provided to you AS IS for your information and personal use and may not be sold / licensed / shared on other websites without getting consent from its author. Content is provided to you AS IS for your information and personal use only. Download presentation by click this link. While downloading, if for some reason you are not able to download a presentation, the publisher may have deleted the file from their server. During download, if you can't get a presentation, the file might be deleted by the publisher.

E N D

Presentation Transcript


  1. Figure S1. Plots of estimated CIs of 771 QTL and 125 mQTL, projected onto the sorghum consensus map QTL colour coded by trait category as follows: Grain - red Leaf – dark blue Maturity - yellow Panicle - pink Abiotic stress resistance – bright green Biotic stress resistance - brown Stem composition – bright blue Stem morphology – dark green mQTL: hashed boxes The 35 major-effect genes identified in Mace and Jordan (2010) are highlighted in red.

More Related