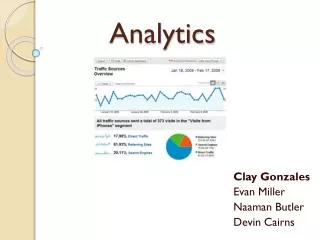
Analytics
Analytics. By Mark Barrera twitter.com/mark_barrera. http://bit.ly/markbga. Objectives. Overview & installation Understanding your visitors Referring source analysis Keyword analysis (branded & non-branded)

Analytics
E N D
Presentation Transcript
Analytics By Mark Barrera twitter.com/mark_barrera http://bit.ly/markbga
Objectives • Overview & installation • Understanding your visitors • Referring source analysis • Keyword analysis (branded & non-branded) • Tracking other marketing efforts including PPC, social media, email, offline promotions, etc • URL shortener usage for Analytics • Automating and analyzing reports • Advanced tracking techniques (PDF downloads, etc)
How Google Analytics Works? There are essentially five steps: • A visitor loads a page on your website • In the process, browser loads and runs Javascript from Google • Javascript collects information about the visitor • The information is sent to Google by requesting a URI (Uniform Resource Identifier) • A program on Google's end then stores all the detailed observations that were recorded by the Javascript. All those details are analyzed and displayed in pretty graphs.
Installation GA Installation Guide - http://bit.ly/markbgasetup Step 1 - Create a Google Analytics accountStep 2 - Configure your profileStep 3 - Edit the tracking code for custom website setupsStep 4 - Add the tracking code to your pagesStep 5 - Link with your AdWords accountStep 6 - Create goals and funnelsStep 7 - Tag your advertising campaignsStep 8 - Creating FiltersStep 9 - Grant access to other usersStep 10 - Enable e-commerce transaction tracking
Interface & Navigation Bounce Rate: Bounce rate is the percentage of single-page visits (i.e. visits in which the person left your site from the entrance page). Visits: Visits represent the number of individual sessions initiated by all the visitors to your site. Pageviews: A pageview is defined as a view of a page on your site that is being tracked by the Analytics tracking code. Avg. Time on Site: Avg. Time on site is one way of measuring visit quality. If visitors spend a long time visiting your site, they may be interacting extensively with it. Pages/visits: An average number of pages a visitor have consumed on your website. %New Visits: A percentage of new visits out of the total visits on your website on the basis of cookies.
Interface & Navigation Calendar/Timelines: You can select a different timeline or date range for extracting data. Data Comparison: Data of two different timelines can be compared.
Interface & Navigation One Metric: Here you can select the metric in which you want graph to be displayed. Compare Two Metrics: Here you can select two different metrics for comparison and displayed on the graph. Compare to site: Your site can be compared on various available metrics with other industry specific sites & displayed on the graph.
Interface & Navigation All Traffic Sources: How do people referred from search engines, sites, and tagged links compare to the "average" visitor to your site? The graph shows the overall trends while the table shows the specific sources (i.e. search engines, sites, and tagged links) driving the trends. Direct Traffic: How do the people who clicked a bookmark to come to your site or typed your site URL into their browser compare to the "average" visitor to your site? Direct traffic can include visitors recruited via offline (i.e. print, television) campaigns. Referring Sites: How do the people referred from other sites compare to the "average" visitor to your site? The graph shows the overall trends in traffic volume from referrals while the table lists the sites driving the trends. Search Engines: How does search engine traffic compare to traffic as a whole to your site? The graph shows overall trends while the table lists the search engines driving the trends. Keywords: How does traffic from search keywords compare to traffic as a whole to your site? The graph shows overall trends while the table shows the keywords driving the trends.
Interface & Navigation Top Content Shows you the most popular pages on your site and what they contribute to your site’s overall performance. Content by Title Which are the most commonly viewed groups of pages on your site (grouped by title), and how are they used? This report provides the same information that is in the "Top Content" report, but aggregated by title tag value. Content Drilldown This report allows you to view your content by drilling down into the folder structure you've set up on your site.
Interface & Navigation Total Conversions: A daily or hourly breakdown of total goal conversions. Conversion Rate: The percentage of visits that result in the visitor taking an action that you have defined as important to your business. Abandoned Funnels: Goal abandoned funnels shows the number of times a visitor started a conversion activity without completing it. Goal Value: Goal Value is the total revenue realized from goal conversions. Funnel Visualization: At what point do visitors who begin a defined funnel process abandon it?
Branded versus Non-branded keywords The pipe symbol, |, symbolizes the logical expression OR. For example, if you are looking at the Keywords report and you only want to see those keywords that contain the strings “horsa" or “reax" or “ultimo", you can type horsa|reax|ultimo into the Find Keyword box at the bottom of the report. This would allow you to filter for ‘containing’ and ‘excluding’ to either show your branded or non-branded traffic
Tracking PPC / Social Media / etc Default Tracking Method By default, traffic from Twitter will be tracked as referral traffic in Google Analytics. if someone clicks on a link to your site from a tweet you will see ‘www.twitter.com’ in the Referrals report.
Tracking PPC / Social Media / etc AdWords Campaign (AdWords): How do the people referred from your AdWords Campaigns compare to the "average" visitor to your site? Click an AdWords Campaign in the table to see its component ad groups and keywords. The "Clicks" tab displays the AdWords cost, impression, and ROI data useful for monitoring the profitability of your AdWords Campaigns and keywords. Keyword Position (AdWords): Where do your AdWords ads appear on Google search results pages and how much influence does search position have on volume (Visits) and visit quality (Avg. pageviews, conversion rates, per visit value)? Use this report to determine your optimal search position for each keyword and plan your bidding accordingly. Drill down from any keyword to see its display position: T1 through T3 indicate that your ad was promoted to the top of the search results page. Positions 1 through 8 indicate a position in the right-hand column on the first page. Campaigns: How do the people referred from your configured campaigns compare to the "average" visitor to your site? The graph shows overall trends while the table lists each of your configured campaigns. Since all traffic in this report results from campaigns that you explicitly control, you can use this information to add or delete campaigns, or to determine the effectiveness of tests that you have set up using custom tags. Ad Versions: How do your AdWords ads (and configured campaigns in which you have use the "content" tag) compare against each other? This report shows you which ad copy (in AdWords ads or in configured campaigns) is most effective. Ads with high clickthrough rates show that the copy is effective at getting the user to click, while high bounce rates, for example, indicate a need for landing pages that are consistent with what the ad promises.
Tracking PPC / Social Media / etc Preferred Tracking Method A better way to track a Twitter campaign would be to use GA’s campaign tracking feature. This method will track anyone visiting the site as a result of your tweet, regardless of where they clicked on the URL. It doesn’t matter if it’s in an email client, hosted email app. etc.
Tracking PPC / Social Media / etc Let’s dig deeper. I’m really interested in knowing how people are using Twitter. Are they on their mobile (like me) or PC? This can have a big impact on how they interact with my tweet. Let’s segment the tweet by OS:
Tracking PPC / Social Media / etc http://www.markbarrera.com/?utm_source=twitter&utm_medium=social&utm_campaign=tweets-non-promo http://bit.ly/markbex1
Custom Reports Quick Start Guide for Custom Reporting - http://bit.ly/markbgacr
Custom Reports Metric (columns) A metric is a quantitative measure of how visitors interact with your site. Metrics include things like pageviews (the number of times visitors viewed a page), time on page (the amount of time they spent looking at a page), and bounce rate (the percent of visitors that leave your site after only 1 page). The important thing to remember here is that metrics are always numerical. Metrics will be your column headings, horizontally across the top of your report. Dimension (rows) A dimension is a characteristic of a visitor or a page on your website that you can use to organize your metrics. Dimensions are almost always text, such as "new" vs "returning" (visitor type) or "North America" vs "Europe" (region). Dimensions will make up the rows in your report and will let you drill-down to multiple levels of detail (e.g. you can click on "Google" to learn more about that referring site).
Tracking PDFs, AVI, WMV, etc Google Analytics provides an easy way to track clicks on links that lead to file downloads. Because these links do not lead to a page on your site containing the tracking code, you'll need to tag the link itself with the _trackPageview() JavaScript if you would like to track these downloads. This piece of JavaScript assigns a pageview to any click on a link - the pageview is attributed to the filename you specify. For example, to log every click on a particular link to www.example.com/files/map.pdf as a pageview for /downloads/map you would add the following attribute to the link's <a> tag: <a href="http://www.example.com/files/map.pdf" onClick="javascript: pageTracker._trackPageview('/downloads/map'); ">
Tracking Outbound Links For example, to log every click on a particular link to www.example.com as a pageview for /G1/example.com you would add the following attribute to the link's tag: <a href="http://www.example.com" onClick="javascript: pageTracker._trackPageview("/G1/example.com");"> It is a good idea to log all of your outbound links into a logical directory structure as shown in the example. This way, you will be able to easily identify what pages visitors clicked on to leave your site. To verify that _trackPageview() is being called correctly, you can check your Top Content report 24 to 48 hours after the updated tracking code has been executed. You should be able to see the assigned pagename in your report. Step 2: Use the Artificial Pagename as the Goal URL You can now set the Goal URL as: /G1/example_com
Tracking Flash/Videos Google Analytics lets you track any browser based event, including Flash and JavaScript events by using the _trackPageview function, you can assign a page filename to any Flash action, and enter that filename into the appropriate goal or funnel step. Flash Code Examples: on (release) { // Track with no action getURL("javascript:pageTracker._trackPageview('/folder/file.html');"); } on (release) { //Track with action getURL("javascript:pageTracker._trackPageview('/folder/file.html');"); _root.gotoAndPlay(3); myVar = "Flash Track Test"; } onClipEvent (enterFrame) { getURL("javascript:pageTracker._trackPageview('/folder/file.html');"); }
Benchmarking Benchmarking is an optional Google Analytics service that shows how your website's statistics compare against other industry verticals. In the beta version of this service, you are able to compare your site's Visits, Pageviews, Pages per Visit, Bounce Rate, Average Time on Site,and New Visits data against benchmark data from categories of other participating websites. You can use this data to gain broader context for your site so you can identify additional opportunities to improve your site's metrics.
Filtering Data • Custom filters: • Exclude Pattern • Include Pattern • Search & Replace • Advanced: This type of filter allows you to build a field from one or two other fields. • Uppercase / Lowercase: These filters only affect letters, and will not affect characters or numbers. • Predefined filters: • Exclude all traffic from a domain • Exclude all traffic from an IP address (whatismyip.com) • Include only traffic to a subdirectory
Thank You! mark@markbarrera.com 214-908-0954 @mark_barrera www.markbarrera.com