Download
1 / 1
30 likes | 247 Vues
13. 14. 9. 5. 1. 2. 3. 7. 0.1. Figure 5. Age-adjusted death rates for selected leading causes of death: United States, 1958-2005. 1,000.0. ICD-7. ICD-8. ICD-9. ICD-10. Diseases of heart 1. Malignant neoplasms 1. Cerebrovascular diseases 1. 100.0.

E N D
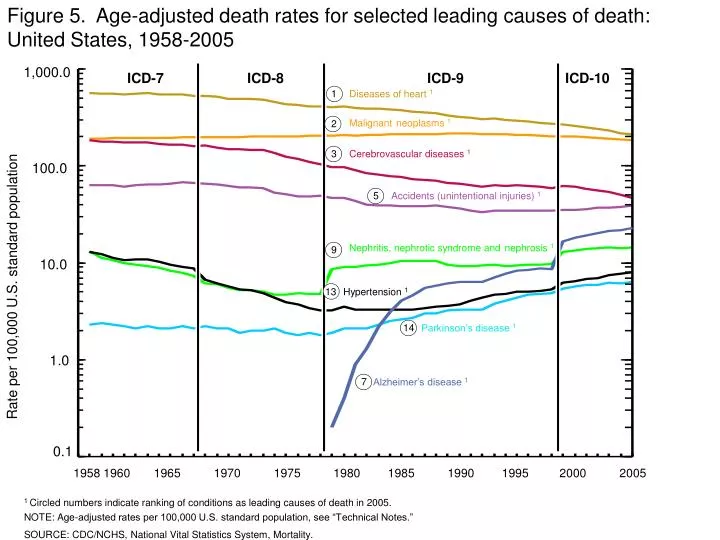
13 14 9 5 1 2 3 7 0.1 Figure 5. Age-adjusted death rates for selected leading causes of death:United States, 1958-2005 1,000.0 ICD-7 ICD-8 ICD-9 ICD-10 Diseases of heart 1 Malignantneoplasms 1 Cerebrovascular diseases 1 100.0 Accidents (unintentional injuries) 1 Nephritis, nephrotic syndrome andnephrosis 1 Rate per 100,000 U.S. standard population 10.0 Hypertension 1 Parkinson’s disease 1 1.0 Alzheimer’s disease 1 1958 1960 1965 1970 1975 1980 1985 1990 1995 2000 2005 1 Circled numbers indicate ranking of conditions as leading causes of death in 2005. NOTE: Age-adjusted rates per 100,000 U.S. standard population, see “Technical Notes.” SOURCE: CDC/NCHS, National Vital Statistics System, Mortality.