Download
1 / 55
560 likes | 624 Vues
This comprehensive study delves into the intricacies of stabilizing and disruptive selection in various species, highlighting the impact on traits such as birth weight, gall size, and coat color. The research also covers QTL analysis, Price's Rule, and Fisher's Fundamental Theorem of Natural Selection, shedding light on the genetic mechanisms behind evolutionary processes. Additionally, the limitations imposed by small population sizes and trade-offs among life-history traits are explored, offering insights into the evolutionary consequences in natural populations.

E N D
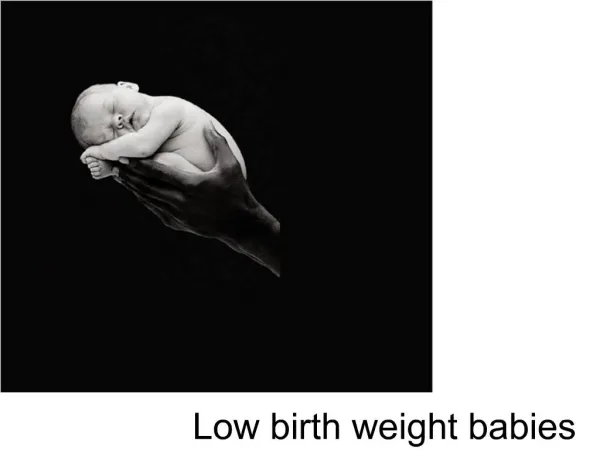
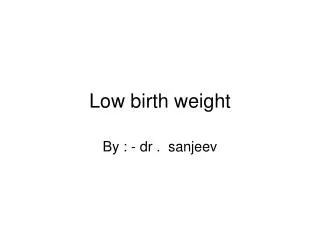
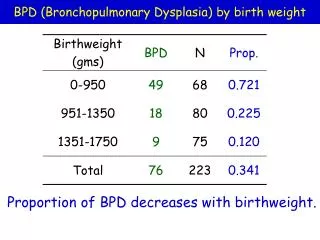
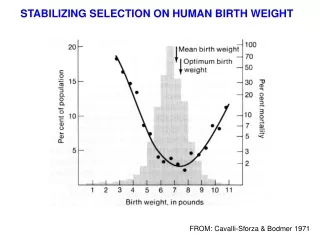
STABILIZING SELECTION ON HUMAN BIRTH WEIGHT FROM: Cavalli-Sforza & Bodmer 1971
STABILIZING SELECTION ON THE FLY, Eurosta solidaginis Parasitoid Wasp – Eurytoma gigantea
STABILIZING SELECTION ON THE FLY, Eurosta solidaginis Downy woodpecker
Stabilizing selection on gall size • Intermediate size favored
STABILIZING SELECTION ON THE FLY, Eurosta solidaginis • Two sources of mortality from predators: • Parasitoid wasps • Hungry Birds FROM: Weis & Abrahamson (1996) IN: F & H 2001
DISRUPTIVE SELECTION Pyrenestes o. ostrinus
DISRUPTIVE SELECTION • Disruptive selection on bill size in the black-bellied seedcracker (Pyrenestes o. ostrinus) • Juvenile birds that survive are those with either relatively small or relatively large beaks FROM: Smith (1993) IN: F & H 2001
Quantitative trait locus (QTL) analysis:Establishing the linkage between traits and genes
QTL ANALYSIS OF HOST RACE FORMATION Nature 412:904-907
Coat color variation in oldfield mice Hopi Hoekstra’s Lab
Light coat color evolved independently in different populations
Much of the variation in coat color is explained by differences in two genes Corin also explains a small amount of variation
Expression of Agouti during development influences coat color
FUTURE STUDIES OF SPECIATION: • Quantitative Trait Loci (QTL) mapping in monkey flowers. • QTL analysis is a powerful approach to dissecting the genetic basis of traits directly associated with pre- and post-zygotic isolation.
PRICE’S RULE • The directional selection differential for a character is equal to (and can be measured by) the covariance of individual phenotypes with relative fitness. S = Cov( relative fitness, phenotype) • Where wi = relative fitness of individual i • = absolute fitness of i / mean absolute fitness • w = population mean relative fitness = 1 • Pi = phenotypic measurement of individual i • P = population mean phenotype
FISHER’S FUNDAMENTAL THEOREM OF NATURAL SELECTION • The rate of evolution of mean population fitness is equal to the additive genetic variance in relative fitness.
FISHER’S FUNDAMENTAL THEORM OF NATURAL SELECTION • From Price’s Rule, if the character of interest is fitness itself, then the directional selection differential on fitness itself is, • S = average value of [(wi - w) (Pi - P)] • = average value of [(wi - w) (wi - w)] • = Var (wi) = phenotypic variance in relative fitness
FISHER’S FUNDAMENTAL THEORM OF NATURAL SELECTION From the Breeder’s equation, R = h2S, Response of relative fitness to selection, R = heritability of relative fitness x S additive genetic variance of w = x Var (wi) Var (wi) = additive genetic variation in fitness
FISHER’S FUNDAMENTAL THEORM OF NATURAL SELECTION • If there is any genetic variance in fitness in a population, then natural selection will act on it. • Strong directional selection on fitness is expected to erode genetic variance in fitness. • However, in natural populations there still seems to be genetic variance for fitness related traits.
THE INPUT OF VARIATION BY MUTATION How much variation for quantitative characters is introduced by mutation each generation? Vm = mutational variance = genomic mutation rate (per gen.) x average squared mutation effect Ve = environmental variance for the trait Vm / Ve = MUTATIONAL HERITABILITY
THE RATE OF POLYGENIC MUTATION Species Characters Vm /Ve Drosophila Bristle numbers 0.0017 Daphnia Life-history traits 0.0017 Tribolium Pupal weight 0.0091 Mouse Skull measures 0.0111 Limb bones 0.0234 Growth rate 0.0160 Corn Vegetative and reproductive traits 0.0051 Rice Vegetative and reproductive traits 0.0031 FROM: Lynch, M. 1988. Genetical Res. 51:137-148
0 — + CORRELATIONS AMONG CHARACTERS OR RELATIVES Covariance:
CONSTRAINTS DUE TO TRADE-OFFS • Negative correlations among life-history traits may constrain evolution and maintain genetic variation. • This is called the Antagonistic – Pleiotropy hypothesis.
WHAT ARE THE LIMITS TO PHENOTYPIC EVOLUTION? “A slow sort of country!” said the Queen. “Now, here, you see, it takes all the running you can do, to keep in the same place. If you want to get somewhere else you must run at least twice as fast as that” From Alice in Wonderland Lewis Carroll
The RedQueen may permanently prevent populations from evolving to maximum fitness
WHAT ARE THE EVOLUTIONARY CONSEQUENCES OF SMALL POPULATION SIZE?
THE PRIMARY GENETIC CONSEQUENCES OF SMALL POPULATION SIZE • Loss of additive genetic variance and heterozygosity within populations. • Divergence of mean phenotypes among isolated subpopulations (random genetic drift) • Reduction in mean fitness due to consanguineous matings (inbreeding resulting from exposure of deleterious recessive alleles). • Long-term accumulation of deleterious mutations and eventual extinction due to “mutational meltdown”.
In: R. B. Primack. 1998. Essentials of Conservation Biology. Sinauer
EXTINCTION RATES OF BIRDS AND MAMMALS SINCE 1600 In: R. B. Primack. 1998. Essentials of Conservation Biology. Sinauer
In: R. B. Primack. 1998. Essentials of Conservation Biology. Sinauer
DEFORESTATION AND HABITAT FRAGMENTATION IN MADAGASCAR Extent of eastern rainforest
CHANGING ENVIRONMENTS: GLOBAL WARMING In: R. B. Primack. 1998. Essentials of Conservation Biology. Sinauer
Total Human Population Size in 2011 A.D., 7 Billion The source of our concern over rapidly changing environments, habitat loss, and fragmentation, is the direct relationship between these environmental issues and human population growth. Total Human Population Size in 2000 B.C., <200 Million
CONSERVATION PRIORITIES • In the short-term, the demographic consequences of small populations are likely to be the more important than genetic consequences. However, • In the long-term, genetic factors may be more important in determining whether populations are able to persist.
GENETIC CONSEQUENCES OF SMALL POPULATIONS I. INBREEDING DEPRESSION
Plots of trait value vs. Level of Inbreeding (F) Inbreeding Coefficient (F)
Survival Generations • Relationship Between Infant Survival and Time Since Closing of the Herd • Captive populations of ungulates, Brookfield Zoo, Chicago FROM: Lacy et al. 1993. In, The Natural History of Inbreeding and Outbreeding. Ed. N. W. Thornhill. Univ. Chicago Press
* * * * * % Contribution Founders Contribution of the 18 founders of the North American zoo population of Siberian tigers to the gene pool in 1981. FROM: Foose & Seal (1981).
STRATEGIES TO REDUCE THE IMPACT OF SMALL CAPTIVE POPULATIONS • Genetic augmentation – Introduction of unrelated individuals to the breeding program. This strategy minimized the reduction in fitness due to inbreeding depression. • Pedigree analysis – Tracking the reproductive success of individuals with molecular markers to ensure equal contribution to the gene pool. This maximizes the effective population size (NE) and reduces the loss of genetic variation due to drift.
GENETIC CONSEQUENCES OF SMALL POPULATIONS II. LOSS OF GENETIC VARIATION
LOSS OF HETEROZYGOSITY VS. POPULATION SIZE Rate of loss of genetic variation = 1/2N per generation
} Populations that are able to “track” a changing environment persist. Populations that cannot achieve the critical rate of evolution, decline and eventually go extinct. CHANGING ENVIRONMENT } MEAN PHENOTYPE TIME CRITICAL RATE OF EVOLUTION • Since the level of additive genetic variation (VA) determines the response to selection, populations lacking in VA may not be able to respond to persistent environmental changes.
INFLUENCE OF RANDOM GENETIC DRIFT AND MUTATION ON ADDITIVE GENETIC VARIANCE (VA) The amount of genetic variance in generation t = Genetic variance in generation t-1 – loss due to drift + input due to mutation VA, t = VA, t-1 – (VA, t-1 / 2N) + Vm At equilibrium, VA ,t = VA, t-1 VA = 2NVm • The amount of genetic variation in a population is function of both the population size and the mutation rate.