Download
1 / 4
50 likes | 102 Vues
Explore connections between geometric patterns and representations using x→y tables, graphs, and equations. Analyze growth in patterns through rules and graphs to determine tile patterns' characteristics.

E N D
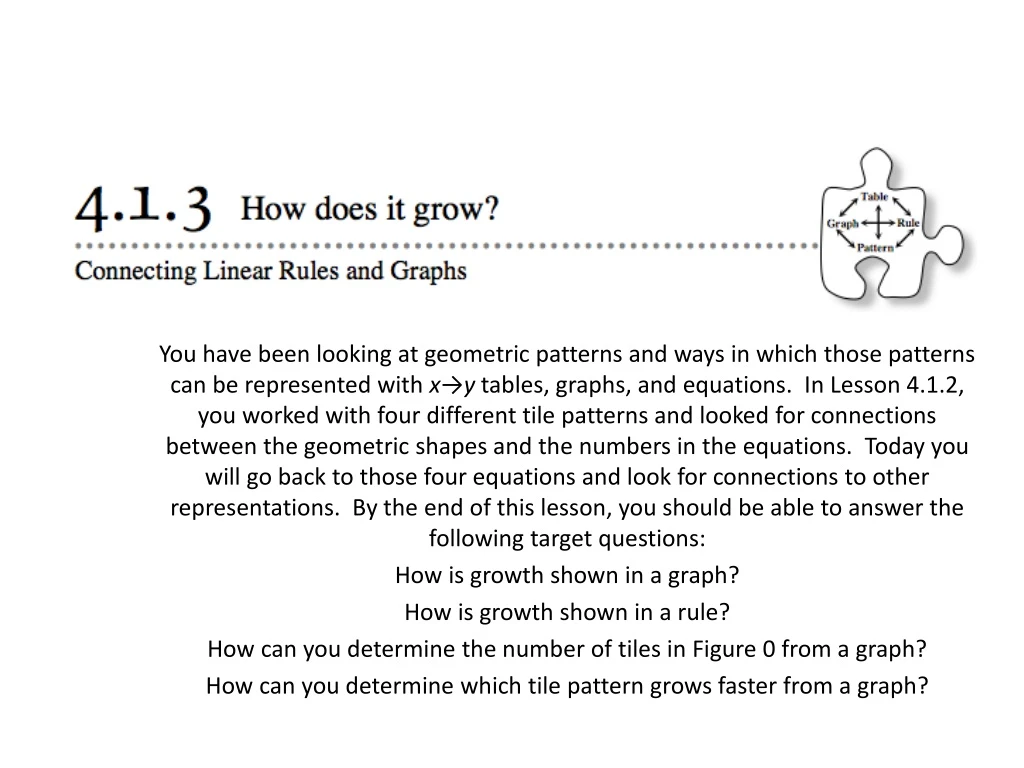
You have been looking at geometric patterns and ways in which those patterns can be represented with x→ytables, graphs, and equations. In Lesson 4.1.2, you worked with four different tile patterns and looked for connections between the geometric shapes and the numbers in the equations. Today you will go back to those four equations and look for connections to other representations. By the end of this lesson, you should be able to answer the following target questions: How is growth shown in a graph? How is growth shown in a rule? How can you determine the number of tiles in Figure 0 from a graph? How can you determine which tile pattern grows faster from a graph?
4-22. Examine your Lesson 4.1.2 Resource Page (“Pattern Analysis”) and obtain a Lesson 4.1.3 Resource Page from your teacher. • Make sure you have a rule for each tile pattern. • Complete the table for each rule. • Create a graph for each pattern. Put all patterns on the same set of axes. Use different colors for each pattern, matching the color you used to show the tile pattern’s growth on the 4.1.2 Resource Page. • Explain how the growth appears in the pattern, in the table, in the graph, and in the rule. • What connections do you see between these representations? Describe any connections you see
4-23. The graph at right gives information about three new tile patterns. Remember that in this course, tile patterns will be considered to be elements of continuous relationships and thus will be graphed with a continuous line or curve. • Answer the following questions as a team. What information does the circled point (O) on the graph tell you about tile pattern A? • Find the growth of each tile pattern. For example, how much does tile pattern A increase from one figure to the next? Explain how you know. • Look at the lines for tile patterns A and B. What is the same about the two lines? What conclusion can you make about these tile patterns? What is different about the lines? What does this tell you about the tile patterns? Use what you see on the graph to justify your answers. • Look at lines A and C on the graph. What do these two lines have in common? In what ways are the lines different? What does this tell you about the tile patterns? Explain completely.
4-24. LEARNING LOG • In your Learning Log, answer the target questions for this lesson, reprinted below. • How is growth shown in a graph? • How is growth shown in a rule? • How can you determine the number of tiles in Figure 0 from a graph? • How can you determine which tile pattern grows faster from a graph? Be sure to include at least one example. Title this entry “Connecting Linear Rules and Graphs” and label it with today’s date.