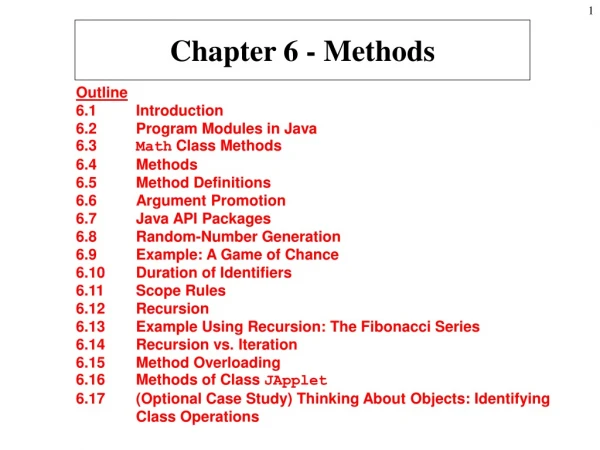
Chapter 6 Kernel Smoothing Methods
Chapter 6 Kernel Smoothing Methods. -Zhang Yuxin. One-Dimensional Kernel Smoothers. Review the K-nearest-neighbor average method in Chapter 2. Use the 30-nearest neighborhood. An example. Nadaraya -Watson kernel-weighted average. Nadaraya -Watson kernel-weighted average.

Chapter 6 Kernel Smoothing Methods
E N D
Presentation Transcript
Chapter 6Kernel Smoothing Methods -Zhang Yuxin
One-Dimensional Kernel Smoothers Review the K-nearest-neighbor average method in Chapter 2 Use the 30-nearest neighborhood
An example Nadaraya-Watson kernel-weighted average Nadaraya-Watson kernel-weighted average with the Epanechnikov quadratic kernel with
Continuous and quite smooth. An Epanechnikovkernel with (half ) window width λ= 0.2
Kernel - Definition • A Kernel K(., .), function of two variables, is an inner product of two vectors that are the image of the two variables under a feature mapping • Inner product is related to a norm (metric) • A kernel can be represented as a decreasing function of a distance between the two objects • a measure of similarity between two objects
Kernels withOne-dimensional Features • D: a decreasing function on R+ • hl(.): • a window with some specified width • a scaling function on R
There are a number of details that one has to attend to in practice: • Large λ implies lower variance but higher bias. • Metric window widths (constant hλ(x)) • keep the bias of the estimate constant but the variance is inversely proportional to the local density. • Nearest-neighbor window • the variance stays constant and the absolute bias varies inversely with local density.
When there are ties in the xi. • observation weights wi. Operationally we simply multiply them by the kernel weights before computing the weighted average. • Boundary issues arise. The metric neighborhoods tend to contain less points on the boundaries, while the nearest-neighborhoods get wider. • The Epanechnikov kernel has compact support (needed when used with nearest-neighbor window size). Another popular compact kernel is based on the tri-cube function
This is flatter on the top (like the nearest-neighbor box) and is differentiable at the boundary of its support. The Gaussian density function D(t) = Ф(t) is a popular noncompact kernel, with the standard deviation playing the role of the window size.
The smooth kernel fit still has problems: Locally-weighted averages can be badly biased on the boundaries of the domain, because of the asymmetry of the kernel in that region.
By fitting straight lines rather than constants locally, we can remove this bias exactly to first order Locally weighted regression
Consider the following expansion for local linear regression
Local Polynomial Regression We can fit local polynomial fits of any degree d the bias will only have components of degree d+1 and higher • increased varianceis a price to be paid for this bias reduction
Local linear fits can help bias dramatically at the boundaries at a modest cost in variance. Local quadratic fits do little at the boundaries for bias, but increase the variance a lot.
Local Regression in IRP Let b(X) be a vector of polynomial terms in X of maximum degree d.
Boundary effects are a much bigger problem in two or higher dimensions, since the fraction of points on the boundary is larger. Local regression becomes less useful in dimensions much higher than two or three. It is impossible to simultaneously maintain localness (=>low bias) and a sizable sample in the neighborhood (=>low variance) as the dimension increases, without the total sample size increasing exponentially in p.
it is probably more useful in terms of understanding the joint behavior of the data.
Structured Local Regression Models in IRP Structured Kernels • standardize each variable to unit standard deviation • use a positive semidefinite matrix A to weigh the different coordinates:
Structured Regression Functions We are trying to fit a regression function E(Y︱X) = f(X1;X2; : : : ;Xp) in IRp, in which every level of interaction is potentially present. Analysis-of-variance (ANOVA) decompositions • varying coefficient models Suppose, for example, that we divide the p predictors in X into a set (X1;X2; : : : ;Xq) with q < p, and the remainder of the variables we collect in the vector Z. We then assume the conditionally linear model For given Z, this is a linear model, but each of the coefficients can vary with Z. It is natural to fit such a model by locally weighted least squares:
Here we model the diameter of the aorta as a linear function of age, but allow the coefficients to vary with gender and depth down the aorta. We used a local regression model separately for males and females.
Kernel Density Estimation and Classification • Kernel Density Estimation Parzen estimate In this case a popular choice for Kλ¸ is the Gaussian kernel Letting Фλ¸ denote the Gaussian density with mean zero and standard-deviation λ, then In IRP the natural generalization of the Gaussian density estimate amounts to using the Gaussian product kernel
Kernel Density Classification Use nonparametric density estimates for classification in a straightforward fashion using Bayes' theorem.
The Naive Bayes Classifier The naive Bayes model assumes that given a class G = j, the features Xk are independent: we can derive the logit-transform (using class J as the base):
Radial Basis Functions and Kernels Functions can be represented as expansions in basis functions: Treating the kernel functions Kλ(ξ ,x) as basis functions. standard Gaussian density function. There are several approaches to learning the parameters {ξ j, λj, βj}, j = 1,…,M. For simplicity we will focus on least squares methods for regression, and use the Gaussian kernel. While it would seem attractive to reduce the parameter set and assume a constant value for λj = λ, this can have an undesirable side effect of creating holes-regions of IRP where none of the kernels has appreciable support. Renormalized radial basis functions, avoid this problem
Given the former, the estimation of the latter is a simple least squares problem. Often the kernel parameters λj and ξj are chosen in an unsupervised way using the X distribution alone. An example The Nadaraya{Watson kernel regression estimator in IRP can be viewed as an expansion in renormalized radial basis functions,
Mixture Models for Density Estimation and Classification The Gaussian mixture model has the form (6.32) with The parameters are usually fit by maximum likelihood, using the EM algorithm • If in addition σm = σ > 0 is fixed, and M↑N, then the maximum likelihood estimate for (6.32) approaches the kernel density estimate (6.22) where = 1=N and = xm. The mixture model also provides an estimate of the probability that observation i belongs to component m,
An example Figure 6.17 shows an application of mixtures to the heart disease riskfactor study. Fit a two-component mixture of the form (6.32) with the (scalars) ∑ 1 and ∑ 2 not constrained to be equal.