Download

1 / 7
70 likes | 195 Vues
This study investigates the correlation between wind direction and observed Bromine Monoxide (BrO) concentrations in parts per trillion by volume (pptv) during the 2010 Greenland field mission. Utilizing regression fitting, the bootstrap method, and correlation coefficient testing, we aimed to validate the hypothesis of correlation. Data, collected from May 26 to June 20, 2010, at Summit Station, revealed low correlation (coefficient value of 0.1539), but the bootstrap method confirmed this finding. Notably, wind direction averaged at 192° (S), with the best regression fit being the Least Squares method.

E N D
Correlation Between Wind Direction and Observed BrO concentrations Jeffery A. Shook 26 Apr 11
Objectives and Hypothesis • Hypothesis: • Wind direction and BrOconcentrations (pptv) are correlated. • Objectives: • Using regression fitting, bootstrap method, and correlation coefficient test the hypothesis above.
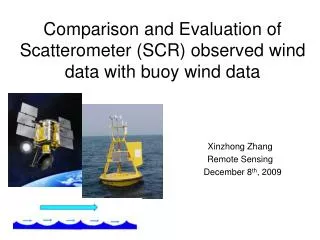
Data Acquisition • Data used was collected during the 2010 Greenland field mission using a Chemical Ionization Mass Spectrometer • Data collected from 26 May 10 to 20 Jun 10. • Location: Summit Station Greenland (72°35'46.4"N 38°25'19.1"W)
Conclusions • BrO concentrations have small correlation due to low correlation coefficient value (0.1539) • Bootstrap method confirmed correlation coefficient • Average wind direction: 192 deg. (S) • Best correlation regression—Least Squares method.