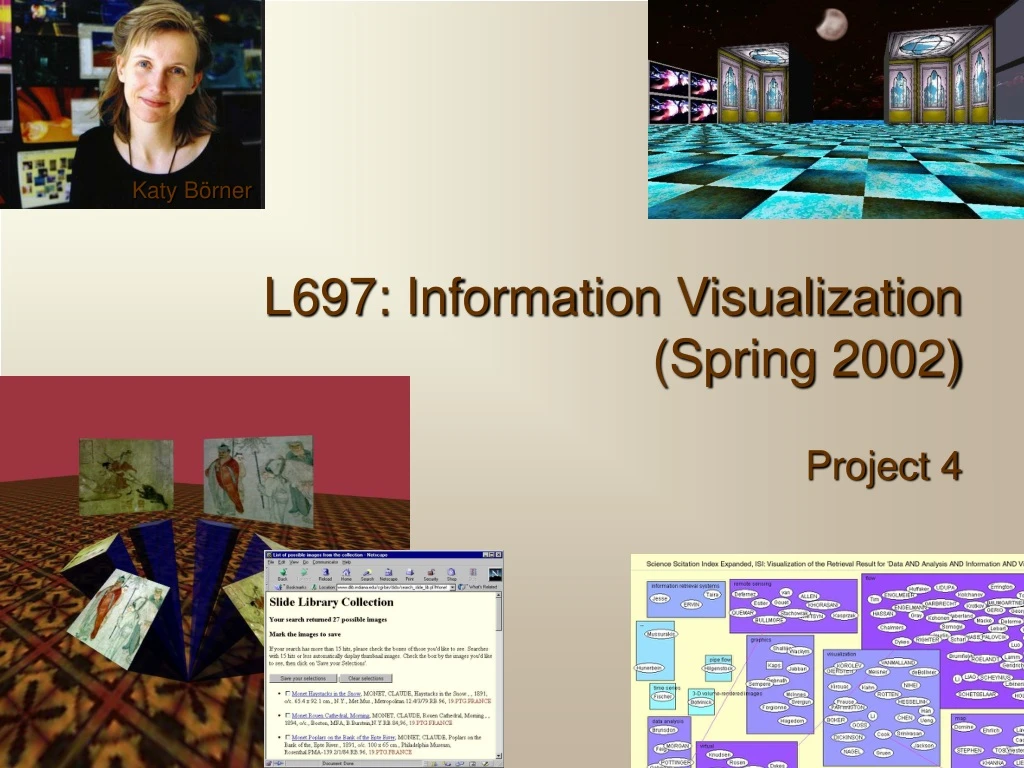
L697: Information Visualization (Spring 2002)
230 likes | 252 Vues
interaction, layout algorithms, data mining, scientific paper

L697: Information Visualization (Spring 2002)
E N D
Presentation Transcript
Final Project • Concentrates on interaction. • Uses layout algorithms (project 2) and data mining (project 3) to visualize meaningful information. Differs from previous projects in that you will • Work with a faculty/staff ‘client’. • Create an interactive visualization that might be used beyond this course. • Write a scientific paper. L697: Information Visualization
Final project options We got six projects that will be presented by 1. Title of the project 2. Main contact person 3. Data you have (data format, amount & sample subset) 4. Intended users (researcher, lay persons) 5. Visualization goal (what do to visualize) 6. Desired interactivity (zoom, filter, ...) + Vision of how the visualization should look & interact. + Similar systems + Katy’s vision of the interface L697: Information Visualization
Cognitive Science’s papers & board of reviewers 2. Rob Goldstone, Psychology, rgoldsto@indiana.edu 3. All papers published so far, current reviewers plus their areas of specialization 4. Web browsers, people interested in the journal 5. Visualize CogSci papers, show how well different areas of CogSci are covered by reviewers. See similarity among reviewers. Match up articles with reviewers. Optional: Filter out keywords. Search paper, reviewer, see their areas of expertise. See all reviewers with expertise in particular area. “Highly visible – LSA, PfNet or MDS intensive – map” L697: Information Visualization
JAIR Space (Foltz, 1999)http://www.infoarch.ai.mit.edu/jair/) L697: Information Visualization
http://pubmed.antarcti.ca/ L697: Information Visualization
How to visualize information on how many documents a certain cluster contains AND semantic relationships among documents in each cluster? L697: Information Visualization
Semantic TreeMapcombines treemap and semantic layout document by term matrix -> LSA -> sim matrix -> clustering -> cluster hierarchy -> select best partition, preserve number of documents in each cluster -> visualize as treemap + apply spring algorithms for each area in treemap. Result: Treemap that visualizes number of documents in each topic area. If you click in area you get to see semantic relationships between the documents in each area. Optional: Zooming – preserves context. L697: Information Visualization
Semantic Treemap click Results in area expansion and semantic layout becomes visible. L697: Information Visualization
CogSci sketch Papers Reviewers Search Map of papers or reviewers Robotics Reviewer-keywords, paper-full_text -> LSA-> SemanticTreemap Need to download articles from http://www.elsevier.nl/gej-ng/10/15/15/show/toc.htt L697: Information Visualization
D-Lib Interface 2. Javed Mostafa, jm@indiana.edu 3. Papers published in D-Lib – authors, keywords, full text. www.dlib.org, Archive is at http://www.dlib.org/back.html 4. Researchers, D-Lib readers • The visualization should display relationships among relevant terms that appear in the back issues and should also allow the user to click on terms to retrieve the issue/s where the terms appear. • For term extraction and weighting I can provide the relevant algorithms. • But for visualization the students should use proper algorithms suggested in the class. • Practical use: The visualization/s thus generated would be visual online indexes to online literature (in this case e-magazines). L697: Information Visualization
PRISM – Intelligent selection of info resources: Effect of query manipulation on search engine results 2. Ryan Scherle, CS rscherle@cs.indiana.edu 3. Data Set: TREC data -- mixed XML and HTML. Total size about 6GB, 1 million documents. Reasonable subsets of various sizes can be easily generated.4. Researchers, but hopefully it would be transparent enough for a lay person to also use. 4. Intended users: Researchers 5. Visualize document location in topic-space. (See http://www.unt.edu/ir/papers/ipm1.html for simple examples) 6. Desired interactivity: Highlighting (filtering) of documents selected by various queries. Depending on the size of the data set chosen, zoom capability may be necessary. Vision of how the visualization should look & interact. The main visualization would be a 2D or 3D map of topic space. Various points in the space would change color as they were selected by a retrieval engine (provided). It would be wonderful to implement the converse: Allow the the user to select portions of the topic space through mouse drags, and produce a list of all documents in that portion of the space. L697: Information Visualization
Genome Data 2. Sun Kim, Informatics, sunkim@bio.informatics.indiana.edu 3. There are many different types of data to visualize. One data immediately available is a 100 X 4000 matrix, where subsets of data needs to be visualized in a dynamic way. 4. Researchers, but hopefully it would be transparent enough for a lay person to also use. L697: Information Visualization
InfoVis Toolkit: Fisheye Table • a. Contact: Jason Baumgartner, SLIS, jlbaumga@indiana.edu • b. Data: Any data in a tabular format • c. Intended Users: All possible users and future IV students • d. Visualization Goal: Visualize a tabular data set in a spreadsheet using zooming instead of scroll bars. • e. Desired Interactivity: zooming, focus + context • f. Value for IV Students: Implement software code that requires an understanding of zooming and focus + context principles in IV. L697: Information Visualization
InfoVis Toolkit: Refine TreeMap • a. Contact: Jason Baumgartner, jlbaumga@indiana.edu • b. Data: Any data in a hierarchy format with some attribute information • c. Intended Users: All possible users and future IV students • d. Visualization Goal: Visualize hierarchy data in a more complete and scalable treemap software package, which allows for analysis of differing attributes and zooming into sub trees in the treemap. • e. Desired Interactivity: space filling layout, zooming, attribute comparisons, mouse handling, etc. • f. Value for IV Students: Implement software code that requires an understanding of space filling algorithms in IV. L697: Information Visualization
InfoVis Toolkit: Refine Spring • a. Contact: Jason Baumgartner, jlbaumga@indiana.edu • b. Data: Extracted from LSA similarity matrix or pfnet. • c. Intended Users: All possible users and future IV students • d. Visualization Goal: Improved visualization and clustering of data from the sim matrix within the spring algorithm. • e. Desired Interactivity: force directed placement, user defined clustering which allow the user to select a range of elements based on values and/or GUI interaction • f. Value for IV Students: Implement software code that requires an understanding of force directed placement algorithms in IV. L697: Information Visualization
Guidelines for project write-up (adopted from Shneiderman, http://otal.umd.edu/Olive/Class/) Title, Authors, Addresses, Electronic Mail, and Date Abstract: 100-150 words Overview of visualization problem, data mining and visualization approach utilized, results, and discussion. • Introduction 1-2 printed page(s) Overview of the visualization problem, possibly including: • Personal encounters with the problem • Current interface • Review of other systems / IVs • Discussion of extracts from relevant textbooks • Relevant psychological or other theories L697: Information Visualization
2. Visualization Goal1-2 printed page(s) discuss users, their tasks & available data 3. Data Mining/Parsing2-3 printed page(s) Present and discuss the data mining/parsing approach(es) you used 4. Visualization & Interaction3-4 printed page(s) Present and discuss the visualization algorithm(s) used. Which psychological features are met? Discuss the interaction possibilities – strengths & problems. Include image(s) of your visualization! 5. Discussion1-2 printed page(s) User feedback, complexity & scaling issues. Desirable modifications & extensions. L697: Information Visualization
Acknowledgementsa few sentences Thanks to people who helped you. If you work in a team indicate who worked on which part. References5-20 references Links to all sources you used & to related work. Complete citations! Appendices2-50 pages possibly including: A. Raw data B. Compiled data C. Statistics runs from computer D. Screen plots L697: Information Visualization
Final project timeline 03-06-2002 Presentation of Project Options 03-27-2002 (1 week later + Spring Break) Present your project sketch during lab 04-10-2002 (2 weeks later) Present your (partially functional) interface during lab 04-17-2002 (1 week later) Handin draft write-up for feedback 04-23-2002 (1 week later) Handin final write-up (ca. 10 pages) 04-24-2002 Final project demo L697: Information Visualization
Projects are graded according to • The technical quality, including its reliability, ease-of-use, internal consistency, robustness, and performance, and • The quality of the content, including the accuracy and completeness of information, the expressiveness and clarity in communication of ideas, and the appropriateness of the attribution(s) for the work of others. As for project 4, I will especially look at the • Appropriate selection of data set, data mining algorithm, and visualization & interaction approach that match your users and their tasks. • Reliability, ease-of-use, internal consistency, robustness, and performance of the implementation. • Quality of Write–up. L697: Information Visualization