
Frequency Distribution of Salinity Index Value and Qualitative Rating in Kaspa x Parafield Progeny
This analysis presents the frequency distribution for salinity index values and their corresponding qualitative ratings for Kaspa x Parafield RIL progeny after exposure to a salinity treatment of 18 dS/m. The classifications include tolerant (T), moderately tolerant (MT-T), moderately sensitive (MS-S), sensitive (S), and high sensitivity (HS). Understanding the salinity response in these progeny is crucial for breeding programs aimed at enhancing salt tolerance in crops.

Frequency Distribution of Salinity Index Value and Qualitative Rating in Kaspa x Parafield Progeny
E N D
Presentation Transcript
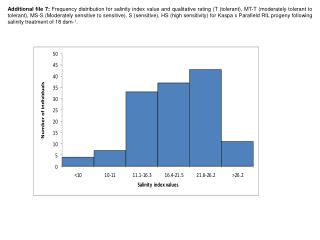
Additional file 7: Frequency distribution for salinity index value and qualitative rating (T (tolerant), MT-T (moderately tolerant to tolerant), MS-S (Moderately sensitive to sensitive), S (sensitive), HS (high sensitivity) for Kaspa x Parafield RIL progeny following salinity treatment of 18 dsm-1.