Download
1 / 23
230 likes | 308 Vues
In September 2006, the city of Brandon embarked on a journey to revamp its waste management strategy, necessitated by the inefficiencies and challenges of the existing system. This involved extensive research, analysis, and comparison between the old and proposed new systems to evaluate performance, cost-effectiveness, and sustainability. Key findings from waste audits and equipment analyses revealed the urgent need for change. The transition to a new system offers numerous advantages, including improved efficiencies, reduced maintenance costs, and alignment with industry standards. Four strategic options were considered, each aimed at enhancing service quality while minimizing environmental impact. The proposed changes also focus on enhancing refuse truck performance and increasing waste diversion rates. To ensure the success of the new system, effective education programs and continuous improvement initiatives are crucial, along with monitoring and addressing contamination rates. This comprehensive approach aims to elevate the waste management practices in Brandon for a better, sustainable future.

E N D
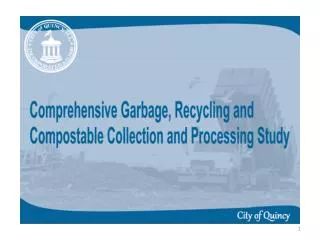
New City of Brandon Refuse/ Recycling Collection System The Need for Change
Background September 2006 had first planning meeting October 2006 initiated a Request for Information (RFI) Fall 2006 completed a waste audit to determine recovery rates by container type Visited Regina, Saskatoon & Toronto to review their equipment Winter 06/07 completed a detailed analysis of our current equipment and container inventory
City council requested that a new waste management strategy be developed after reviewing the information provided by RFI • Old System • New System
Purpose of RFI • Evaluate current system • Evaluate potential new systems • Develop cost effective and sustainable direction for operations • Industry experience & knowledge of others • Long term interests of citizens, staff & management – Quality Service
Waste Audit Continued • Showed a big difference between the recovery rates from single use containers compared to multi use containers • 16.36% recovered using single use containers • 7.43% recovered using multi use containers
Equipment Analysis • Trucks and containers were both at the end of their useful life cycles • Containers were showing increased failure rates • Parts were becoming harder to find and more expensive for trucks and containers
Maintenance Comparison • May 3rd – September 28th, 2005 – Repairs • Rollouts 236 • 300’s 15 • 600’s 184 • Total 435/105 days = 4.14 repairs/day • August 31st – October 25th, 2006 – Repairs • Rollouts 160 • 300’s 25 • 600’s 100 • Total 285/38 days = 7.5 repairs /day • 82% increase in container failure from 2005 to 2006
Old System Pros • Familiarity – Operator & Residence • Durability • Can maintain high level of control with front street system • High public acceptance
Old System – Cons • Obsolete • Lane containers difficult to handle • Hard to source replacement parts • Cost of replacement parts • No longer sustainable • High maintenance costs • Outside users using lane containers • Issue with overhead wires • Slow cycle times • Low compaction rates
New System - Pros • Move collection system to one container type for the majority of inventory. • Maintenance and replacement costs are significantly lower. • Refuse and Recycling picked up separately • Units are the current industry standard. • Better productivity • Lower purchase price for containers • Much quicker cart pick up and cycle times • Better compaction allow for less travel time to landfill
New System – Cons • Number of containers is substantially increased. • May be difficult to implement in some areas of the city. • Not ideal for high density users
Options • 4 Options were included in Waste Management Strategy
Option 1 – Current collection System – Blue Bag recycling collection • Option 2 – Blue bag recycling & single user refuse containers – 16,000 containers & 4 trucks • Option 3 – Purchase of 5 collection trucks and 32,000 containers for separate refuse/recycling collection • Option 4 – Manual curbside recycling – 2 trucks and 3 refuse trucks, 16,000 containers and 16,000 blue boxes
Benefits of Change • Improved efficiencies • Increased diversion of waste entering landfill cell • Alignment with current industry standards • Decrease in capacity of 14%
Truck Performance • Cycle Time and Compaction Rates • Existing Trucks • Cycle Times • Packer – 30 seconds • Lift Cycle – 22 -30 seconds • Compaction Rates • 477 - 600 lbs/cubic yard • New Trucks • Cycle Times • Packer – Continuous Pack • Lift Cycle – 10 seconds • Compaction Rate • 677 – 800 Cubic yards
Factors Effecting Success • Effective education programs must be developed in order to increase participation • Residents can greatly impact the performance of the system • Certain segments need specific programming • Multi-family • Disabled and elderly residents • Core area • Continuous Improvement • Feedback from residents and staff • Monitor system performance and adjust accordingly • Contamination of materials entering MRF