ARDA Experiment Dashboard
ARDA Experiment Dashboard. Ricardo Rocha (ARDA – CERN) on behalf of the Dashboard Team. Outline. Background Dashboard Framework VO Monitoring Applications Job Monitoring Site Monitoring / Efficiency Data Management Monitoring Additional Applications Conclusion and Future Work.


ARDA Experiment Dashboard
E N D
Presentation Transcript
ARDA Experiment Dashboard Ricardo Rocha (ARDA – CERN) on behalf of the Dashboard Team
Outline • Background • Dashboard Framework • VO Monitoring Applications • Job Monitoring • Site Monitoring / Efficiency • Data Management Monitoring • Additional Applications • Conclusion and Future Work To change: View -> Header and Footer
Background • Started in 2005 inside the EGEE/ARDA group • First application: Grid Job / Application Monitoring for the CMS experiment • implementation in PHP / Python • Redesign early 2006 • fully python based solution • more modular / structured approach • easily extensible • Additional application areas: data management (ATLAS DDM), site efficiency monitoring, … To change: View -> Header and Footer
Dashboard Clients Scripts: pycurl, … Command line tools (optparser + pycurl) Shell based: curl, … Web Application Apache + mod_python Model View Controller (MVC) pattern multiple output formats: plain text, CSV, XML, XHTML GSI support using gridsite Agents collectors: RGMA, ICXML, BDII, … stats generation, alert managers, … Service Configurator pattern common configuration (XML file) and management: stop, start, status, list common monitoring mechanism Data Access Layer (DAO) interfaces available to different backends (Oracle and PostgreSQL mainly, easy to add additional ones) connection pooling Dashboard Framework Web / HTTP Interface Agents Data Access Layer (DAO) To change: View -> Header and Footer
Dashboard Framework • Build and development environment • based on python distutils (with several extensions) • covers code validation, binaries and documentation generation, unit testing and reports • automatic build for each of the release branches • packaging uses RPMs – APT repository available • Release procedure • three main branches: nightly, unstable, stable • releases per component • enforced versioning scheme (no manual versioning or tagging, all done via distutils command extensions) • Interesting links • Developers guide: • http://dashb-build.cern.ch/build/nightly/doc/guides/common/html/dev/index.html • Savannah Project • http://savannah.cern.ch/groups/dashboard To change: View -> Header and Footer
Job Monitoring • Real time and summary views over the virtual organization (VO) grid jobs • Several instances in production serving different communities: CMS, ATLAS, LHCb, Alice, VLMED • Various grid information sources used: • RGMA • GridPP XML files collection • LCG BDII • Value added: VO specific information • through job instrumentation. Using Monalisa's ApMon (CMS), Panda and Ganga monitoring (ATLAS) • directly querying VO databases (ex: ATLAS production database) • Key Features: • sensible merging of information from different sources • advanced filtering for different usages (VO manager, site admin, community user) To change: View -> Header and Footer
Job Monitoring • Real time and summary views over the virtual organization (VO) grid jobs • Several instances in production serving different communities: CMS, ATLAS, LHCb, Alice, VLMED • Various grid information sources used: • RGMA • GridPP XML files collection • LCG BDII • Additional VO specific information • through job instrumentation. Using Monalisa's ApMon (CMS), Panda and Ganga monitoring (ATLAS) • directly querying VO databases (ex: ATLAS production database) • Key Features: • sensible merging of information from different sources • advanced filtering for different usages (VO manager, site admin, community user) To change: View -> Header and Footer
Job Monitoring • Task Monitoring • deployed and used in CMS • Integration with SAM tests • already using the new LCG standards • prototype in place • Alert mechanism • in development • HTTP API for publishing job information • very easy to integrate with existing tools • similar to the mechanism used for data management To change: View -> Header and Footer
Grid / Site Efficiency • Built on top of the job monitoring data • Main goal: identify reasons for job failures in sites • Uses the information coming from RGMA • Available today for the same set of communities: ATLAS, CMS, LHCb, Alice, VLMED • Provides both summary and detailed information • Current ongoing work • provide generic (non VO) specific view over the data To change: View -> Header and Footer
Grid / Site Efficiency • Built on top of the job monitoring data • Main goal: identify reasons for job failures in sites • Uses the information coming from RGMA • Available today for the same set of communities: ATLAS, CMS, LHCb, Alice, VLMED • Provides both summary and detailed information • Current ongoing work • provide generic (non VO) specific view over the data To change: View -> Header and Footer
Grid / Site Efficiency • Built on top of the job monitoring data • Main goal: identify reasons for job failures in sites • Uses the information coming from RGMA • Available today for the same set of communities: ATLAS, CMS, LHCb, Alice, VLMED • Provides both summary and detailed information • Current ongoing work • provide generic (non VO) specific view over the data To change: View -> Header and Footer
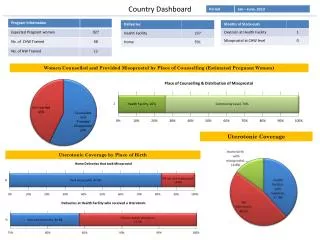
Data Management • Tied to the ATLAS Distributed Data Management (DDM) system • Used successfully both in the production and Tier0 test environments • Data sources: • DDM site services: the main source, providing all the transfer and placement information • SAM tests: for correlation of DDM results with the state of the grid fabric services • Storage space availability: from BDII but soon including other available tools • Views over the data: • Global: site overview covering different metrics (throughput, files / datasets completed, ...); summary of the most common errors (transfer and placement) • Detailed: starting from the dataset state, to the state of each of its files, to the history of each single file placement (all state changes) To change: View -> Header and Footer
Data Management • Tied to the ATLAS Distributed Data Management (DDM) system • Used successfully both in the production and Tier0 test environments • Data sources: • DDM site services: the main source, providing all the transfer and placement information • SAM tests: for correlation of DDM results with the state of the grid fabric services • Storage space availability: from BDII but soon including other available tools • Views over the data: • Global: site overview covering different metrics (throughput, files / datasets completed, ...); summary of the most common errors (transfer and placement) • Detailed: starting from the dataset state, to the state of each of its files, to the history of each single file placement (all state changes) To change: View -> Header and Footer
Data Management • Tied to the ATLAS Distributed Data Management (DDM) system • Used successfully both in the production and Tier0 test environments • Data sources: • DDM site services: the main source, providing all the transfer and placement information • SAM tests: for correlation of DDM results with the state of the grid fabric services • Storage space availability: from BDII but soon including other available tools • Views over the data: • Global: site overview covering different metrics (throughput, files / datasets completed, ...); summary of the most common errors (transfer and placement) • Detailed: starting from the dataset state, to the state of each of its files, to the history of each single file placement (all state changes) To change: View -> Header and Footer
Data Management • Other features • periodic site behavior reports (sent by email) • alerts (on specific errors, when a site goes below a certain threshold, ...) • Coming soon • user specific views (authentication via X509 certificates) – “my datasets” • better site summary data: overview of dataset / file states in the site (radar plots), average time in each placement step, additional error summaries • python query API module • python publish API module (open the tool to other applications / communities) To change: View -> Header and Footer
Conclusion • The Dashboard monitors the grid from the point of view of its communities • and focuses on the different user's interests (managers, admins, end users) • Grid information is not enough (additional VO information is invaluable) • Framework • Flexible and stable: proven by the variety of applications available in production • Effort put into install / packaging paid off: first external installation has already been done (VLMED) • Future work • integration with local monitoring systems (feed summaries back to the site admins) • improved alert system • adapt to recently defined data exchange / query standards • http://dashboard.cern.ch To change: View -> Header and Footer