Aggregate Data: Statistics and Summaries
Learn the basics of aggregate data, including what it is, why it's important, and how to compute it. Explore the relationship between statistics and data, tabulating vs. aggregating, and creating aggregate data structures.

Aggregate Data: Statistics and Summaries
E N D
Presentation Transcript
Aggregate Data and Statistics Wendy Watkins Carleton University Chuck Humphrey University of Alberta Statistics Canada Data Liberation Initiative CAPDU/DLI Training May 29th, 2002
Outline • What are aggregate data? • Why aggregate? • How to aggregate? • Computing exercise
What are aggregate data? Let’s start with the relationship between statistics and data.
Statistics and Data Data • numeric files created and organized for analysis • requires processing • not ready for display Statistics • numeric facts/figures • created from data, i.e, already processed • presentation-ready
Statistics and Data In short, statistics are created from data and represent summaries of the detail observed in the data.
What is aggregation? Building on this previous example, let’s explore aggregation. We see a table with the number of smokers summarized over categories for age, education, sex, geography, and different time points.
Categories of Periods A Statistic Categories of Sex Categories of Region
What is aggregation? Aggregation involves tabulating a summary statistic across all of the categories or levels of a set of variables.
The summary statistic The summary statistic in this example is the total number of smokers.
Variables and categories The variables and their categories are: Region (11): Canada and the ten provinces Age (5) : Total, 15-19, 20-44, 45-64, 65+ Sex (3) : Total, Female, Male Education (4) : Total, Some secondary or less, Secondary graduate or more, Not stated Periods (5) : 1985, 1989, 1991, 1994-95, 1996-97
Variables and categories The tabulation consists of determining the combinations of all categories across variables and then counting the number of smokers within each of these combinations. 11 x 5 x 3 x 4 x 5 = 3300 category combinations
Tabulating or aggregating One might be wondering if there is a difference between tabulating and aggregating? Usually, they are the same thing.
Tabulating = aggregating In creating tables from data, the variables are arranged in various combinations along the columns and the rows.
Tabulating = aggregating Placing multiple variables along the columns or rows is called nesting. Tables may have variables nested on both the columns and rows.
Categories of Education nested within Sex Categories of Sex nested within Region
A quick summary Up to this point, we have noted that • statistics are created from data • aggregations consist of tabulating statistics within the categories of select variables • variables may be nested within columns and rows to display these tabulations
What are aggregate data? What is the difference between a tabulation or aggregation and aggregate data? The display of the aggregation, that is, the structure of the tabulated output.
What are aggregate data? A statistical data structure is a fixed, two-dimensional matrix with the variables in the columns and cases in the rows. V1 V2 V3 V4 V5 V6 V7 Case 1 Case 2 Case 3 Case 4 Case 5 Case 6 Case 7
What are aggregate data? Aggregate data require the same type of statistical data structure. Consequently, aggregate data are a special type of tabulation where variables are nested along the rows but not along the columns.
(11) (5) (3) (4)
Aggregate Data Structure To create an aggregate data structure for the example tabulation, the combination of categories representing geography (region), three social variables (age, sex, and education), and time (period) must all be nested along the rows, as shown in the previous slide.
Another example This time the table consists of the average length of stay in hospital by sex, age, diagnostic chapter, region, and time period.
Variables and categories diagnostic chapter : 19 levels sex : 3 levels age : 6 levels region : 13 levels period : 28 levels
Aggregate data structure The number of category combinations is equal to: 13 x 28 x 3 x 6 x 19 = 124,488 category combinations
Aggregate average length of hospital stays in days The aggregate structure is represented by the 124,488 cells created by the combination of all categories from these five variables. The statistic is the average length of stay in the hospital in days.
What are aggregate data? Definition: Statistical summaries over categorical variables representing social phenomena, geography, and time that are organized in a specific data structure.
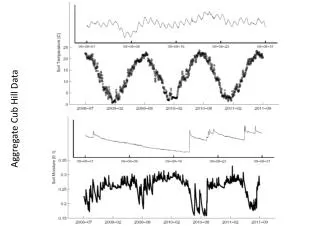
Time series aggregate data When the data structure of the summaries is organized around time, these aggregate statistics are called a time series.
Geo-spatial aggregate data When the data structure of the summaries is organized around geography, we recognize these aggregations as geo-spatial or geo-referenced statistics.
Province Census Divisions Census Sub-divisions
Why aggregate? Statistics Canada creates aggregate statistics from its major surveys, including the Census, as a way of publishing selected findings. The release of aggregate statistics is a partial safeguard against the possible disclosure of respondents.
Why aggregate? Furthermore, the geographic distribution of statistics in Canada is important. As a result, aggregate statistics are released by Statistics Canada for different levels of geography – from the nation to small areas.
Why aggregate? Statistics organized into time series is another way in which Statistics Canada publishes a large amount of statistical information. These time series reflect summaries of data that are repeatedly collected over time and permit studies about trends and change.
Why aggregate? • To publish findings • To safeguard against disclosure • To provide geographic distributions of statistics • To present statistics over time
Why aggregate? Other reasons to aggregate • To modify geo-referenced statistics for GIS applications • for example, finding postal codes within their corresponding EA and then aggregating data from the postal code level up to the EA level
Why aggregate? Other reasons to aggregate • To change the unit of analysis • for the purposes of a specific research question • to create a common, higher-level unit of analysis that can be used in merging files
How does one aggregate? • Identify the grouping structure that represents all of the variables and their categories over which the aggregation is to be conducted. • This group structure defines a new unit of analysis.
How does one aggregate? • Establish the sort order for the grouping variables, i.e., decide which variable increments the fastest, the next fastest, until you reach the variable that changes the slowest. • Select the summary statistics, such as sums, averages, minimums, maximums, etc.
How does one aggregate? The actual aggregation is performed using statistical software such as SAS or SPSS. SAS offers a couple of different procedures and the Data step that can be used to aggregate data, including Proc Summary, Proc Tabulate, and Proc Means.
How does one aggregate? SPSS has the Aggregate command.
Only nesting of the row variables Multiple levels of geography and time Aggregation