Download
1 / 39
400 likes | 697 Vues
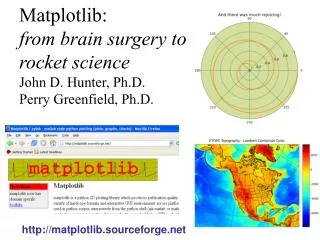
Matplotlib: from brain surgery to rocket science John D. Hunter, Ph.D. Perry Greenfield, Ph.D. http://matplotlib.sourceforge.net. brain surgery…. dongle. pbrain. loc3djr. http://pbrain.sourceforge.net. The three stages of python . Matlab hell Python purgatory The path to enlightenment.

E N D
Matplotlib:from brain surgery to rocket scienceJohn D. Hunter, Ph.D.Perry Greenfield, Ph.D. http://matplotlib.sourceforge.net
loc3djr http://pbrain.sourceforge.net
The three stages of python • Matlab hell • Python purgatory • The path to enlightenment
3D python fantastic, but 2D? PyX, ChartDirector, biggles, DISLIN, gnuplot, chaco, xplt, gplt, pyngl, ppgplot, tkinter canvas, gtk-extras, pychart, gist, piddle, graphite…. • Easy plots should be easy (OO not always best) • But app embedding should be supported (OO sometimes best) • GUI agnosticism • The curse of python • Multiple plotting idioms • Cross platform • Publication quality • Permissive license • Extensible (by me!)
# matplotlib 0.1 ~/python/matplot_gtk12> ls README matplotlib.py subplot_demo.py data simple_plot.py view_data.py matplot.py stock_demo.py vline_demo.py • 2-5 active developers at any time; 25 contributors • Co-developed with NASA STScI and JPL • 1200-1500 downloads/month • approx 10 messages per/day on mailing list # matplotlib 0.73 53 python modules 17 files of extension code 44,000 lines of code 130 examples
The matplotlib API from matplotlib.backends.backend_agg import FigureCanvasAgg as FigureCanvas from matplotlib.figure import Figure fig = Figure() canvas = FigureCanvas(fig) ax = fig.add_subplot(111) ax.plot([1,2,3]) a ax.set_title('hi mom') ax.grid(True) ax.set_xlabel('time') ax.set_ylabel('volts') fig.savefig('test')
pylab interface • Plotting should just work • Easy plots should be easy • GUI / interactive complexity should be managed • ipython to the rescue IPython 0.6.12_cvs -- An enhanced Interactive Python. ? -> Introduction to IPython's features. %magic -> Information about IPython's 'magic' % functions. help -> Python's own help system. object? -> Details about 'object'. ?object also works, ?? prints more. Welcome to pylab, a matplotlib-based Python environment help(matplotlib) -> generic matplotlib information help(pylab) -> matlab-compatible commands from matplotlib help(plotting) -> plotting commands In [1]: plot([1,2,3])
The numerix module # numarray fromnumarrayimportarray, where fromnumarray.linear_algebra.mlabimport std fromnumarray.convolveimportconvolve fromnumarray.fftimportfft # Numeric fromNumericimportarray, where fromMLabimport std fromNumericimportconvolve fromFFTimportfft # matplotlib.numerix frommatplotlib.numeriximportarray, where from matplotlib.numerix.mlab import, mean, std # choose numeric or numarray from the shell C:> python myscript.py --numarray # or in an rc file setting numerix : ‘numarray’
font manager • Cross platform font finding: win32, linux, OS X • Configurable families: the font engine will pick the best font to match your requirements • W3C compliant font.family : sans-serif font.style : normal font.variant : normal font.weight : medium font.stretch : normal font.size : medium font.serif : New Century Schoolbook, Century Schoolbook L, Utopia, ITC Bookman, Bookman, Bitstream Vera Serif, Nimbus Roman No9 L, Times New Roman, Times, Palatino, Charter, serif font.sans-serif : Lucida Grande, Verdana, Geneva, Lucida,
mathtext demo tex = r'$\cal{R}\prod_{i=\alpha_{i+1}}^\infty a_I … \rm{sin}(2 \pi f x_i)$' text(1, 1.6, tex, fontsize=30)
basemaptoolkit cylindrical equidistant, mercator, lambert conformal conic, lambert azimuthal equal area, albers equal area conic and stereographic.
Did I talk about? • Event handling • set/set Introspection • RC configuration • Embedding • Dynamic/animated plots • Math text • Contouring • Toolkits / basemap • Font management
…from astronomy to zoology? • Basic 3D • Different colorspaces (CMYK) • Arbitrary clipping paths, gradient/pattern fills • Unicode support & better TeX support • Domain specific toolkits • SWF, PDF, Aqua, … • Direction fields, arrows, etc
MATPLOTLIB CREDITS (in order of appearance…) • Jeremy O'Donoghue wrote the wx backend • Andrew Straw provided much of the log scaling architecture, the fill command, PIL support for imshow, and provided many examples • Charles Twardy provided the impetus code for the legend class and has made countless bug reports and suggestions for improvement. • Gary Ruben made many enhancements to errorbar to support x and y errorbar plots, and added a number of new marker types to plot. • John Gill wrote the table class and examples • David Moore wrote the paint backend • Todd Miller contributed the TkAgg backend and the numerix module, which allows matplotlib to work with either numeric or numarray. He also ported image support to the postscript backend, with much pain and suffering. • Paul Barrett overhauled font management to provide an improved, free-standing, platform independent font manager with a WC3 compliant font finder and cache mechanism and ported truetype and mathtext to PS • Perry Greenfield overhauled and modernized the goals and priorities page, implemented an improved colormap framework, and has provided many suggestions and a lot of insight to the overall design and organization of matplotlib. • Jared Wahlstrand wrote the SVG backend
MATPLOTLIB CREDITS (continued) • Steve Chaplin is the GTK maintainer and wrote the Cairo and GTKCairo backends • Jim Benson provided the patch to handle vertical mathttext • Gregory Lielens provided the FltkAgg backend and several patches for the frontend, including contributions to toolbar2, and support for log ticking with alternate bases and major and minor log ticking • Darren Dale did the work to do mathtext exponential labeling for log plots. • Paul Mcguire provided the pyparsing module on which mathtext relies, and made a number of optimizations to the matplotlib mathtext grammar. • Fernando Perez has provided numerous bug reports and patches for cleaning up backend imports and expanding pylab functionality, and provided matplotlib support in the pylab mode for ipython. He also provided the matshow command. • Andrew Dalke of Dalke Scientific Software contributed the strftime formatting code to handle years earlier than 1900 • Jochen Voss maintained the PS backend and has contributed several bugfixes. • Nadia Dencheva of STScI provided the contouring and contour labeling code • Baptiste Carvello provided the key ideas in a patch for proper shared axes support that underlies ganged plots and multiscale plots • Sigve Tjoraand Ted Drain and colleagues at the JPL collaborated on the QtAgg backend • Eric Firing added the contourf function and general contour refactoring