Download
1 / 8
80 likes | 192 Vues
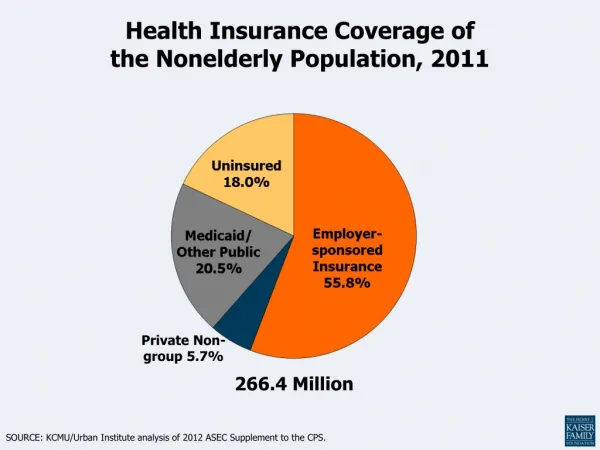
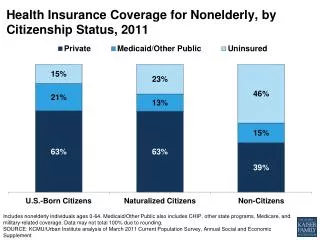
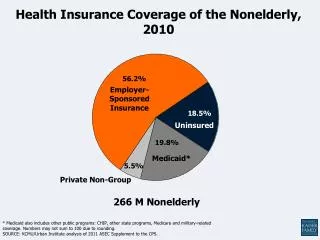
Health Insurance Coverage of the Nonelderly, 2010. * Medicaid also includes other public programs: CHIP, other state programs, Medicare and military-related coverage. Numbers may not sum to 100 due to rounding.

E N D
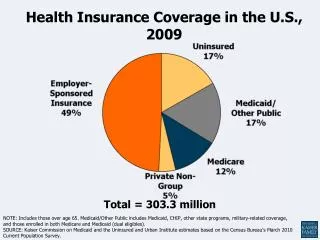
Health Insurance Coverage of the Nonelderly, 2010 * Medicaid also includes other public programs: CHIP, other state programs, Medicare and military-related coverage. Numbers may not sum to 100 due to rounding. SOURCE: KCMU/Urban Institute analysis of 2011 ASEC Supplement to the CPS. Employer-Sponsored Insurance Uninsured Medicaid* Private Non-Group 266 M Nonelderly
Medicaid plays a critical role for selected populations Percent with Medicaid coverage: Families Aged & Disabled SOURCE: Kaiser Commission on Medicaid and the Uninsured and Urban Institute analysis of ASEC Supplement to the CPS; Birth data from Maternal and Child Health Update: States Increase Eligibility for Children's Health in 2007, National Governors Association, 2008; Medicare data from USDHHS.
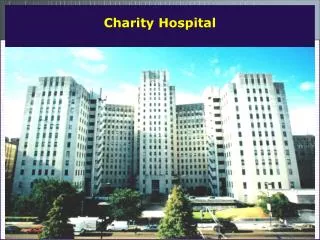
Medicaid Facilitates Access to Care for Nonelderly Adults In past 12 months. Respondents who said usual source of care was the emergency room were included among those not having a usual source of care. All differences between the uninsured and the two insurance groups are statistically significant (p<0.05). SOURCE: KCMU analysis of 2011 NHIS data.
The elderly and disabled account for the majority of Medicaid spending NOTE: Percentages may not sum to 100 due to rounding. SOURCE: KCMU/Urban Institute estimates based on data from FY 2009 MSIS and CMS-64, 2012. MSIS FY 2008 data were used for MA, PA, UT, and WI, but adjusted to 2009 CMS-64. FY 2009 = 62.6 million FY 2009 = $346.5 billion
Medicaid spending growth per capita was slower than private health care spending from 2007 to 2010. Note: Acute Care includes payments to managed care plans. Source: Medicaid estimates from Urban Institute analysis of data from the Medicaid Statistical Information System (MSIS), Centers for Medicare and Medicaid Services (CMS) Form 64, and Kaiser Commission and Health Management Associates data, 2011. Private health insurance and GDP data from Centers for Medicare & Medicaid Services Office of the Actuary, National Health Statistics Group, 2011. Medical care CPI from the Bureau of Labor Statistics, Consumer Price Index Detail Report Tables, 2011.
Expanding Coverage Under the Affordable Care Act * Medicaid also includes other public programs: CHIP, other state programs, Medicare and military-related coverage. The federal poverty level for a family of three in 2012 is $19,090. Numbers may not add to 100 due to rounding. SOURCE: KCMU/Urban Institute analysis of 2011 ASEC Supplement to the CPS. Federal Poverty Level 400%+ Employer-Sponsored Insurance 139-399% (Subsidies) Uninsured <139% (Medicaid) Medicaid* Private Non-Group 266 M Nonelderly
Uninsured Adults By Income, 2010 48% (19.6 M) 52% (21.6 M) Total Uninsured Nonelderly Adults= 41.2 Million Adults includes all individuals aged 19-64. The federal poverty level for a family of three in 2010 was $18,210. Percentages may not sum to 100 due to rounding. SOURCE: KCMU/Urban Institute analysis of March 2011 Current Population Survey, Annual Social and Economic Supplement.
The Federal Government Will Pay for the Large Majority of Medicaid Coverage Costs in Health Reform Note: Adults less than 133% FPL under standard participation scenario. SOURCE: Analysis for KCMU by The Urban Institute, May 2010 Federal 95.4% $443.5 Billion State: 4.5% $21.1 Billion Total: $464.7 billion over 2014-2019