Download
1 / 24
240 likes | 353 Vues
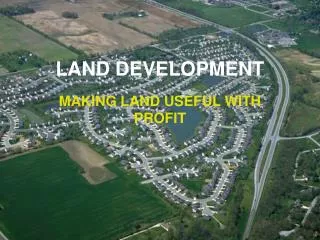
This study by Jon D. Fricker delves into the intricate relationship between transportation and land use, highlighting key issues such as urban sprawl, Euclidean zoning, and responses to gasoline prices. The research emphasizes the impact of changing land use patterns on travel behavior and offers strategies for effective urban development to address these challenges. From neighborhood retail capacity to market analysis and consumer expenditure, the study presents a detailed analysis of how land use decisions influence transportation dynamics. Through case studies and resident preferences surveys, valuable insights emerge on designing sustainable, transit-friendly neighborhoods that cater to diverse needs and preferences. Overall, the research stresses the importance of strategic urban planning to create vibrant, accessible communities.

E N D
Three Things (I think I know) about the Land Use / Transportation Connection Jon D. Fricker 21 June 2007
“Urban Sprawl” Euclidean zoning Gasoline prices Transportation and Land Use Issues 3 Things ... LU/Tp
What the travel model says: 1. Changing Land Use patterns will affect the amount of travel (vehicle-miles traveled) – at least a little. 3 Things ... LU/Tp
2. A neighborhood can support only so much retail activity. What economic analysis says: 3 Things ... LU/Tp
What people say: 3. A New Urbanist neighborhood design is not for everyone. 3 Things ... LU/Tp
Move non-residential LUs into one neighborhood. LUs that fit travel behavior, rather than the opposite Provide LUs that satisfy the most common trip making purposes. 1. Changing LU patterns 3 Things ... LU/Tp
1. Reverse Engineered N’hood A. LU Categories by trip frequency: >1 trip/week, >1 trip/month, <1 trip/month: • Grocery, Gas Station, School, et al. B. Nr of each LU/100 HHs: • Trip rates per 100 HH (NPTS and ITE) for each LU • Average size of each LU C. Scale up to 1 sq mi 3 Things ... LU/Tp
1. REN example calc (1) • 901.58 trips/week/1000 sq. ft. GFA in supermarket • 1.327 trips/week/HH to supermarket • Store area = (1.327/901.58)* 1000 *100 = 147 sq. ft./100 HHs • Avg supermarket size 34K sq ft 0.004 supermarkets per 100 HH • Repeat for all other “frequent” LUs 3 Things ... LU/Tp
1. REN example calc (2) • Repeat for all other “frequent” LUs total land area needed to serve 100 HHs • Assumed HHs/acre land needed • Scale up to fill one square mile “attractions” in REN 3 Things ... LU/Tp
Let residents work and shop anywhere. TAZ size one city block Subarea analysis VMT or Trip Length 1. REN travel model 3 Things ... LU/Tp
1. Changes in Travel 3 Things ... LU/Tp
1. Lessons • Introducing non-residential LUs gives residents a choice of destinations that are closer. • The resulting reductions in trip lengths are noticeable, but not dramatic, at the neighborhood level. • The trip length reductions are barely noticeable at the system level. 3 Things ... LU/Tp
2. Neighborhood businesses • How many retail establishments can a New Urbanist neighborhood support? 3 Things ... LU/Tp
Shift analysis from trips and GFA to $/HH and $/LU type Nhood area one sq mi 5(?) HHs/sq mi Do “Market Analysis” (next two slides) 2. Neighborhood businesses 3 Things ... LU/Tp
2. Consumer Expenditure-Based Market Analysis An average household spends $3000 a year on grocery-store related items. • An average grocery store has sales of $600,000 a year. • Then, the number of grocery stores that can be supported by 100 HHs = $3000 * 100 / ($ 600,000) = 0.5 grocery stores 3 Things ... LU/Tp
2. Household-Based Market Analysis • There are 1000 banks in a state with a population of 100,000 (i.e., 0.01 banks per person). • The average income at the state level is $12,000 a year. • The average income at the county level is $10,000 a year. • Then, the number of banks that can be supported by 100 HHs = 0.01 * 100 * ($10,000/ $12,000) = 0.83 banks 3 Things ... LU/Tp
2. Lessons At “normal” urban densities for single-family dwellings (4-6 HH/acre), a one-square-mile neighborhood cannot support enough stores to cover even one edge. • Density must be increased dramatically, probably by high-rise apartment buildings, or • The “neighborhood” stores must rely on customers from other neighborhoods. 3 Things ... LU/Tp
3. Preference Surveys • Two-part survey at a monthly meeting of a neighborhood association. (1) Rate the desirability of twenty-four types of non-residential land uses if they were located within walking distance of your residence. (2) Three hypothetical New Urbanist-like neighborhood revitalization case studies, differing by location and scale, were presented. 3 Things ... LU/Tp
3. LU Preferences (1) • Churches were most preferred, while liquor stores were ranked lowest. (figure next page) • Land uses visited frequently (e.g. grocery store or restaurant) rated higher than less-frequented ‘benign’ LUs, such as an insurance sales office. • A positive relationship between the frequency of trips taken and the desirability of a particular land use within a neighborhood. 3 Things ... LU/Tp
3. LU preferences (2) 3 Things ... LU/Tp
3. New Urbanist Cases 3 Things ... LU/Tp
Opposed proposed developments in center of neighborhood -- would increase traffic. Development on perimeter acceptable, but few residents would not walk/bicycle to the proposed developments, despite their proximity. 3. Residents’ Opinions • People would still go to more distant stores for longer hours, lower prices, greater variety. 3 Things ... LU/Tp
Not this: But this: In other words, … 3 Things ... LU/Tp
Review of Results • Land use changes can help reduce VMT, but this is a long-term solution. • High densities needed to support “frequent” LUs, but other LUs need a larger market shed. • A minority like New Urbanist design now, but this market niche needs to be nurtured. 3 Things ... LU/Tp