Download
1 / 35
350 likes | 469 Vues
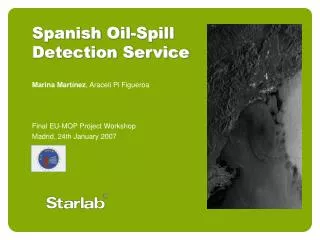
Spanish Oil-Spill Detection Service Marina Martínez , Araceli Pi Figueroa Final EU-MOP Project Workshop Madrid, 24th January 2007. MarCoast: The context. MarCoast is a GMES (Global Monitoring for Environment and Security) ESA project the most important initiative after Galileo

E N D
Spanish Oil-Spill Detection Service • Marina Martínez, Araceli Pi Figueroa • Final EU-MOP Project Workshop • Madrid, 24th January 2007
MarCoast: The context • MarCoast is a GMES (Global Monitoring for Environment and Security) ESA project the most important initiative after Galileo • ESA & EU (2001) wanted to develop the capability of a NRT environmental monitoring (in particular, of the sea) • We are in the scope of 7 groups of environmental European services: • Coast and seas • Polar Services • Land Services
3 years duration (2005-2008) 32 companies and entities from 10 European countries Management of Alcatel Alenia Space Today we have federated around 50 users in Europe. MarCoast consortium
Oil spill Services • Oil spill surveillance and customised information • Oil spill drift forecast
Water quality Services • Water quality monitoring and alert • HAB monitoring, evolution and forecasting • Water quality assessment service • Met-Ocean data
Servicio Español MarCoast OS • Operational Service of oil spill detection in NRT at Spanish waters using remote sensing images ASAR Envisat Images Today: delivering time guaranteed MAX 30min after the satellite over-flight. • Added value: integration of AIS (Automatic Identification System) data of the vessels is the area (phase-2: May-November 2007) and oil spill drift and vessels trajectory forecasts for phase-3 (May-November 2008). • Users: National (Sasemar), and in phase-2 (2007) several ports and regional autorities with policies in water quality/environmental issues in the coast.
Areas of coverage • Phase-1: April-November 2006 only Galicia. • Phase-2: May-November 2007 extension to Catalunya and Mar de Alborán. • Phase-3: May-Nobemver 2008 the three areas.
Segments of the service • SAR-IM: • ASAR image resolution 30m aprox. (píxel) • Frequency every 2-3 days aprox. • All weather and day/night detection capabilities • SAR-OS: • Analysis of the oil spill, number extension, location, realiability in most cases the positive detection depens on the meteo conditions (wind and waves). • SAR-SHIP: • Minimum vessel size detectable depending on the pixel resolution • AIS: • Because the huge volume of data collected at the VTS, a filtering of 1-min around the acquisition time is done.
Service chain AIS data
Service performance: SAR-IM / SAR-OS chains • Scene acquisition through the ENVISAT ASAR sensor (wide/narrow swath mode). • Image donwloaded at Matera Ground Station • Radiometric and ortometric corrections, and geo-referentiation • Image procesing (Telespazio) backscatter coefficient, σ0 , analysis to detect changes in the roughness of the sea surface. • Detection report (pdf) and delivering of geotiff and shape files.
Service performance: SAR-OS chain • Oil spill detection report (pdf) contains: • Acquisition date of the ASAR image processed. • Number of detected oil spills • Oil spill baricenter (latitude/longitude). • Coordinates of the most significative extremes of the oil spill • Surface of the oil spill (Km2), longitude (Km) and width (Km). • Number of oil spills • Reliability in the detection (Low, Medium, High) • Simple schema of the area / map
Service performance: SAR-SHIP chain • Within the ASAR image, those points with σ0 with characteristics of metalic surfaces are detected. • The SHIP report (pdf) on vessels detected in the area contains: • Acquisition date of the ASAR image processed. • Position of the “spot” (in latitude/longitude). • Crosses at the vessels locations • Numbers of vessels detected • reliability of the oil spill detected in teh area
Service performance: AIS chain • From the Envisat acquisitions scheduled at the beginning of every phase, a time window of 1-min around the tadquisition is considered.
Service performance: AIS chain • Selection of those inputs falling in the image area. • Selection of the information fields. • Sending of the AIS file from Sasemar Headquarters to Starlab server (ascii format). • Hour/Date • MMSI (encripted) • Lat/Lon • Course-over-ground (COG) • Speed-over-ground (SOC)
Phase-1, April-November 2006 • Servicio provided throught the web sites http://marcoast.starlab.net • User area password protected only available for the federated users.
Phase-1, April-November 2006 • Service chain: • Envisat image acquisition • Donwload by the Matera ESA ground station • Image processing at Telespazio • Arrival of the image and pdf report at Starlab server • Countour processing of the detected oil spills • Integration of the information in the data base (web site): • SAR image (jpg, shape) • OS and SHIP reports as well oil spill contours (pdf) • Alert e-mail / message to the user (ascii) T0 Maximum deliver time 1.5h Tf
Phase-1, April-November 2006 • Example of NEGATIVE alert message in case of no oil dpill detection.
Phase-1, April-November 2006 • Example of alert messaage in case of POSITIVE detection sent by the service provider to the user.
Phase-1, April-November 2006 • Service validation performed by Sasemar using flights but not in a regular basis (only optical sensors on-board diurnal in-situ validation could be possible). Example:25/08/2006 Envisat acquisition at 22:25:14 UTC
Phase-1, April-November 2006 Diurnal flight during the next day (26/08/2006) to check the oil spill existence.
Phase-1, April-November 2006 • Number of detected oil spills • High reliability: 13 (22.4%) • Medium reliability: 20 (34.5%) • Low reliability: 25 (43.1%) • Statisitcs of the service • Images scheduled: 100 images (2-3 days frequency) • Processed images: 51 images (78.5%) • Failures: • “Satellite/transmission failures”: 9 Images • “Cancellation (out of Matera station coverage)”: 5 Images • Detection: • 27 images without oil spill detection • 24 images with oil spill detection (minimum 1 oil spill): 47%
Phase-2, May-November 2007 • GIS platform installed at the user’s computer • The tool performs direct consultations to the service provider data base (Starlab)
Phase-2, May-November 2007 • Web-site updated in a parallel way only pdf reports, Envisat acquisition calendar, special events publication.
Phase-2, May-November 2007 • Information flow between all the partners involved in the Spanish oil spill Service.
Phase-2, May-November 2007 • Service chain: • Envisat acquisition • Donwload at Matera ground station (ESA station) • Image analysis for oil spill detection at TPZ • Delivering of the analysis at Starlab data base and alert message sending both to Starlab and to the user. • Integration with AIS information in the GIS platform • Availability of the oil spill detection report, image, SHIP detection and AIS data to the final user. T0 Max. delivering time 30 min Tf
Phase-2, May-November 2007 • Message alert equal to Phase-1 • Validation performed by SASEMAR on a regular basis in the three areas using flights and vessels (own means and also asking to ships in the area of interest).
Phase-2, May-November 2007 • Diurnal flight on 22th November perfomed by CCS Barcelona catching the polluter at the area.
Phase-2, May-November 2007 Medium reliability slick
Phase-2, May-November 2007 • Alborán Sea: From the 38 images processed, 17 of these images contain oil-spill detections (45%). The total amount of oil-spill detected are 45, which are distributed as: • Low reliability: 31 (69%) • Medium reliability: 12 (27%) • High reliability: 2 (5%) • Galicia: From the 24 images processed, 6 of these images contain oil-spill detections (25%). The total amount of oil-spill detected are 13, which are distributed as: • Low reliability: 9 (69%) • Medium reliability: 3 (23%) • High reliability: 1 (8%) • Catalonia: From the 36 images processed, 19 of these images contain oil-spill detections (53%). The total amount of oil-spill detected are 45, which are distributed as: • Low reliability: 18 (40%) • Medium reliability: 26 (58%) • High reliability: 1 (2%)
Phase-2, May-November 2007 • Frequency of delivery: Each 1-4 days (avoiding collisions with EMSA acquisition plan) distributed as • Alborán Sea: Mean frequency acquisition = 1.9 days • Galicia: Mean frequency acquisition = 4 days • Catalonia: Mean frequency acquisition = 3,5 days • Mean deliver time from the image acquisition until the image/analysis is available at Starlab server to the customer is 30min and, regarding the area, the statistics is distributed as: • Alborán Sea: Mean deliver time = 28 min • Galicia: Mean deliver time = 30 min • Catalonia: Mean deliver time = 32 min • Failures: Globally there have been 13 Envisat failures over 98 effective delivers, which suppose the 13% of the total acquisitions performed: • Alborán Sea: Failures = 5 over 38 real acquisitions (13%) • Galicia: Failures = 4 over 24 real acquisitions (17%) • Catalonia: Failures = 4 over 36 real acquisitions (12%)
Phase-2, May-November 2007 • Causes of failure in service delivering or final product: • Envisat failure in the image acquisition 13% of the total acquisitions scheduled. • Low confidence level in the oil-spill detectionalgorithms 56% of the total amount of slicks detected had low reliability. • Failure in the completeness of the final productprovided i.e., SAR image analyzed without AIS layer or viceversa. In the phase-2 this has supposed the 3% of the total delivers to the final user. • Internet and/or electricity power failure These cases have been considered as out-layers in the statistical summary, which are the 4% of the scheduled delivering.
Phase-2, May-November 2007 • Concept improvement: • Service performance ensuring delivery of image/report/map: Improvement in the delivering time until 30min average and minimizing the failure delivers (due to many reasons) to the 4% maximum. • Reliability of service: Improvement in the successful delivers up to 96% on the total delivers scheduled. • Improvement of algorithms: Improvement in the amount of MEDIUM reliable oil-spill detected up to the 30% in average for the three areas collected. • Enhancement of spatial resolution: In case of crisis as in the 24th October 2007 at the Tarragona Port, special deliver of oil-spill detection has been performed using ERS-2 images with resolution in the order of 100m. • Additional functionality to fulfil further requirements: AIS chain providing vessel identification has work with 99% success. In phase-3 local/coastal models will provide oil-spill drift up to 24h after the image acquisition. • Additional parameters (e. g. chl, turbidity, …): It is expected that in phase-3 ocean colour distributions will be used for improve the ratio of positive high reliability oil-spill detections.
Conclusions • Users have a positive impression of the service. Extraordinary collaboration of the national user as AIS provider but also as provider of field information for validation purposes. • At least in the 5% of the cases of positive detection the polluter has been identified by the authorities. • Phase-3 (May-November 2008) Combination with vessels trajectory vectors and oceanographic models will make able to forecast the oil spill drift as well the potential pollutant vessel location many hours late of the satellite acquisition. • Combination of this detection service with operational field services in case of pollution disaster is possible and would be a important goal in the fight against the pollution of our seas.
Thank you for your attention!For more information, please contact the service providermarcoast@starlab.esas well the Service Manageraraceli.pi@starlab.es