
Uploaded by
ronald
2 SLIDES
95 VUES
20LIKES
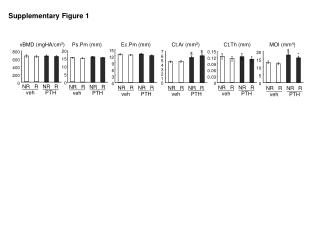
Comparative Analysis of Bone Density and Microstructure in Veh and PTH-Treated Subjects
DESCRIPTION
The supplementary figures depict vBMD, BV/TV, Ps.Pm, Ec.Pm, Ct.Ar, Ct.Th, and MOI measurements in veh and PTH groups. The vBMD values are presented in mgHA/cm3, while BV/TV is shown as a percentage. The figures provide insights into the bone microstructure changes induced by the treatments.
Download
1 / 2
Télécharger la présentation 
Comparative Analysis of Bone Density and Microstructure in Veh and PTH-Treated Subjects
An Image/Link below is provided (as is) to download presentation
Download Policy: Content on the Website is provided to you AS IS for your information and personal use and may not be sold / licensed / shared on other websites without getting consent from its author.
Content is provided to you AS IS for your information and personal use only.
Download presentation by click this link.
While downloading, if for some reason you are not able to download a presentation, the publisher may have deleted the file from their server.
During download, if you can't get a presentation, the file might be deleted by the publisher.
E N D
Presentation Transcript
Supplementary Figure 1 vBMD (mgHA/cm3) Ps.Pm (mm) Ec.Pm (mm) Ct.Ar (mm2) Ct.Th (mm) MOI (mm4) $ $ 15 20 7 800 0.15 $ 20 * 6 12 0.12 15 600 15 5 9 0.09 4 10 400 10 3 6 0.06 2 5 200 5 0.03 3 1 0 0 0 0 0 0 NR R NR R NR R NR R NR R NR R NR R NR R NR R NR R NR R NR R veh PTH veh PTH veh PTH veh PTH veh PTH veh PTH
Supplementary Figure 2 vBMD (mgHA/cm3) BV/TV (%) 20 250 200 15 150 *** 10 *** 100 5 50 0 0 NR R NR R

More Related