Download
1 / 27
280 likes | 311 Vues
This comprehensive guide explores the pivotal role of well logs in the petroleum industry context, covering topics such as lithology identification, stratigraphic representation, lithostratigraphic correlation, and porosity/permeability concepts. Discover how e-logs serve as proxies for stratigraphic sections and aid in understanding rock fluid content and density stratification. Practical exercises and case studies offer insights into structural traps, oil/water contacts, and depositional models critical for geologists in the petroleum sector.

E N D
Using Well Logs (e-logs) in the Petroleum industry Earth Science World
Context • First exposure to well logs - petroleum industry. • Well logs are proxies for stratigraphic sections. • Identify lithology. • Represent stratigraphic sections. • Lithostratigraphic correlation. • Concepts • Porosity & permeability re-visited. • Rocks contain fluids – salty water or petroleum. • Density stratification of fluids in rocks. • Depositional models paramount in petroleum industry. • Practicality of sedimentary geology ---> jobs. • Materials • Borowski - SERC on-line materials. • 1-inch well logs purchased from a log broker, Cambe.
Exercise components • Lithology via well logs – shale vs. unconsolidated sand. • Formation fluids – brine vs. petroleum (oil). • Reinforces concept of porosity and permeability. • Lithostratigraphic correlation using well logs as proxy. • Concept of oil/water contact – density stratification. • Calculate elevation of strata – datum, sea level. • Structural cross section & structural trap. • Test concept of horizontal oil/water contact. • Necessity for geologists and use of depositional models in petroleum industry. Let’s run through the exercise!!
Chandeleur Sound Block 25 Field • St. Bernard Parish, LA • BB Sand - deltaic EODs • 40 MMBO Venice Hyne (2000) BB Sand (Tex. “L”) ~ 9 Ma John et al. (2003)
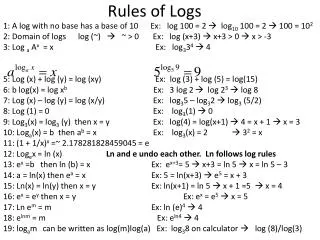
Interpreting logs • SP –spontaneous potential • Passive tool • Voltage between sensors High (+) – impermeable - shale Low (-) – permeable – non-shale • Shale baseline – connect far- right readings • Readings left of baseline • Admixtures of coarser grains w/ shale • Interbedding of sand & shales – different thickness SP shale baseline deep shallow amplified
Resistivity • Deep- & shallow-reading curves (sensor spacing) • Amplified curve • Rock fluid content • Water in pore spaces with increasing residence time - increase [ dissolved ions ] • Brines – high conductivity – low resistivity Low resistivity – brine – left High resistivity – HC? – right SP deep shallow amplified
Depth • 1 inch = 100 feet • 10 divisions each 100 feet • each division = 10 feet • Interval 5123’ – 5200’ MD • Dominant lithology = unconsolidated sand • Interbeds of sand & shale • SP curve kicks left away from shale baseline
Interval 5123’ – 5200’ MD • Deep (left) and shallow (right middle) read low R (high conductivity) • Consistent with brine
Defining the reservoir sand • BB sand & BB marker (EODs) Atlantic S/L 4542 #14 Marine shale – delta avulsion Sheet sand – delta subsidence Crevasse splay Delta lobe Distributary mouth bar
Matching well log curves • Find the correlation in the #4 well, using information from the #14.
curves • Do this correlation for all wells in the cross section.
Identifying brine and petroleum • High resistivity zone at top of BB Sand • Higher resistivity is inconsistent with brine, but consistent with oil (low conductivity). • Bottom of high R is at ~5285 MD. • Brine occurs below – low resistivity = high conductivity. • Top = 5272 MD, bottom = 5285 MD Thickness = ~13’ oil Atlantic S/L 4542 #4 High R
Color-coding lithology and fluid content Atlantic S/L 4542 #4 sand shale oil water yellowbrowngreenblue
Correlating the reservoir across the field • Well log correlation mimics lithostratigraphic correlation.
Petroleum patterns • Oil always occurs atop salty water in the field wells. • This occurs within pore spaces of the reservoir rock due to density difference between oil and water roil < rwater Atlantic S/L 4542 #4
Petroleum patterns • Pore space in rocks is filled either with water, cement (i.e., calcium carbonate, CaCO3), or petroleum. • Almost always water is first within pore spaces and must be displaced by migrating oil. • This process can be modeled by thinking of an upside-down bowl within a tub of water that is injected with salad oil. • Thought experiment or demonstration? Horizontal oil/water contact
Calculating elevation IRT sea level Kelly bushing (KB) – measured depth = elevation IRT elevation target sea level Atlantic 4542 #4 25’ – 5287’ = 5262’ subsea O/W contact Now determine the bottom of oil in each well and determine its subsea elevation, showing your calculation at the bottom of each well log on the cross section.
Testing a hypothesis • Given our experiment, the oil/water contact should be horizontal within Chandeleur Sound Block 25 Field. • This means that the contact should be at the same elevation. • Is it? Look most closely at the 4542 #4 well and compare its oil/water contact to that of the #3 and 4545 #4 wells. • Give plausible reasons why this is or isn’t so.
Testing a hypothesis • Look most closely at the 4542 #4 well and compare its oil/water contact to that of the #3 and 4545 #4 wells. 4542 #4 4542 #3 4545 #4 ~ -5262’ ~ -5270’ ~ -5272’ oil/water contact elev. • Elevation of oil/water contacts differs by at least 10’; maximum is ~ 33’ (#1 : #4 wells).
Testing a hypothesis • Give plausible reasons why the contacts may be different. • E.g., different compartments with sand reservoir.
Need for geology & geologists in the petroleum industry • The vertical (stratigraphic) and lateral distribution of permeable reservoir rock is dependent upon the depositional environment of that rock. • Use depositional models to assess and predict: • reservoir quality (f & k) • reservoir thickness • reservoir compartments. All figures after Reading (1978)
Summary • Serves as an introduction to well logging, proxy interpretation, & the petroleum industry. • More advanced exercise concerning detailed e-log interpretation loaded for this workshop. • My Petroleum Geology materials also available as handouts. • Please do hesitate to contact me concerning improvements (w.borowski@eku.edu). www.icdp-online.org www.logwell.com