Download
1 / 109
1.09k likes | 1.32k Vues
Response to Intervention (RtI) at the Secondary Level. Big Ideas about Today’s Presentation. We’re aligning a delivery system to educational needs. We’re increasing the quality of teaching, tools, and support across 3-Tiers instead of moving the problem.

E N D
Big Ideas about Today’s Presentation • We’re aligning a delivery system to educational needs. • We’re increasing the quality of teaching, tools, and support across 3-Tiers instead of moving the problem. • We’re shifting mind sets: Every problem learning (or behaving) becomes a special education problem. • We’re shifting “Interventions” focus from reactive, punitive, and/or restrictive to proactive, preventative, inclusive. • We have the tools and we have experience, but there is a gap.
Without Problem Solving Special Education Sea of Ineligibility General Education
Student Profiles • 8.7 million 4th-12th graders can’t cope with academic demands • 74% of all 9th graders scored at Unsatisfactory or Basic Level on state assessment • Unsatisfactory = 3%ile WR; 1%ile RC • Basic=9%ile WR; 8%ile RC • 69.2% of adolescents graduate; 51.2 % of students Black; 55% Hispanic • Students who stay “on track” in freshman year (earn 5 credits and no more than 1 F) 3.5 times as likely to graduate • (Diplomas Count 2009," the fourth annual report on graduation rates by Education Week)
Student Profiles (cont) • “On-track Indicator” • Students who stay “on track” in freshman year (earn 5 credits and no more than 1 F) 3.5 times as likely to graduate • One semester F decreases likelihood of graduating from 83% to 60% • 2 Fs decreases likelihood to 44% • 3 Fs decreases likelihood to 31%
Severity of Educational Need or Problem Special Education Amount of Resources Needed To Benefit General Education with Support General Education The “Old” Problem Solving Heuristic
What is NOT RtI: It’s not your father’s Oldsmobile • It’s Not About SE Eligibility with a new label (e.g., pre-referral intervention, old team-new name). • It’s Not About SE “Business as Usual” with programs that meet the needs of adults more than students. • Expecting GE Teachers to meet the needs of ALL students (180 students-180 different interventions).
Difference Between Elementary and Secondary • Elementary: Focus on basic skills (learning to read) • Secondary Focus on content (reading to learn) • Elementary: One to two teachers • Secondary: Five to seven teachers
Difference Between Elementary and Secondary • Elementary:Reading and Writing – Narrative • Secondary: Reading and Writing-Expository • Elementary: Validated Level 1 skill programs • Secondary: Lack of validated Level 1 content programs
What students may need RtI at the Secondary Level? • Students who do ‘okay’ early on but have problems when expectations change • Students who did not get good early intervention • Problems with vocabulary ‘accumulate’ • Wide range of problems: some still struggle with early skills, others have comprehension difficulities
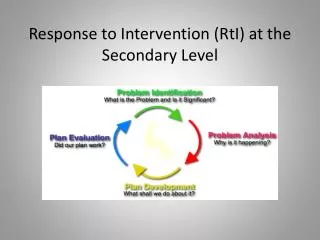
Problem Identification What is the Problem and Is it Significant? Problem Analysis Why is it happening? Plan Evaluation Did our plan work? Plan Development What shall we do about it? Problem Solving Steps
The VISION: To Provide Effective Interventions to Meet the Needs of ALL Students Through Early and Scientifically Based Interventions Through Careful Systems Planning
Information Explosion/Instructional Time Dilemma 1960 Time 1980 Content 2000
Tier One Universal Instruction Is your district meeting AYP at 80%?
Large Group Illustration • Is our initial instruction meeting the needs of enough students? • Historically, there hasn’t been a target on acceptable success rates. • Some kids were successful • Some kids weren’t • Kids who were not successful got different programming through different programs • Screening was haphazard
Large Group Illustration • We have a new assumption to start from: All kids successful • A rate of 80% has been suggested by many researchers and policy makers nationally, as the rate needed for Initial Instruction • The number of kids in strategic or intensive programs can vary based on available resources, 20% seems reasonable
Basics of Universal Screening- • Given to everyone • Critical Skills (using a scientifically-based measure) • Brief • Repeatable • Cheap and easy to administer and score • Tells us who needs more assessment
Basics of Universal Screening • Typically done three times per school year to determine which students are at risk for failure. • Interventions or differentiated instruction based on assessment results can then be given to these students.
Tier Two • -Tier One PLUS… • -Small Group Interventions • -For at-risk students • Includes programs, • strategies, and procedures • designed and employed to • supplement, enhance, and • support Tier 1. Tier Two 5-10% of All Students
Tier Two Supplemental Interventions Hypotheses • That the students require additional time for direct instruction • That the focus of the curriculum must narrow in order for students to gain the skills
Characteristics of Tier Two Interventions • Available in general education settings • Opportunity to increase exposure (academic engaged time) to curriculum • Opportunity to narrow focus of the curriculum • Sufficient time for interventions to have an effect (10-30 weeks) • Often are “standardized” supplemental curriculum protocols
Tier Three • -Tier One PLUS… • -Tier Two PLUS… • -Intensive interventions • -Specifically designed and • customized interventions • Very small groups of students 1-5% of All Students
/ 12 11 10 9 8 7 6 5 4 3 Years in School The Performance Gap / The University of Kansas Center for Research and Learning
The Performance Gap / Grade Level Expectations Demands Skills Existing Support Years in School The University of Kansas Center for Research and Learning
Infrastructure Supports The Performance Gap Grade Level Expectations Demands Skills • Infrastructure Support • Flexible Scheduling • Planning Time • Professional Development Time • Extended Learning Time • Smaller Learning Communities / Existing Support Years in School The University of Kansas Center for Research and Learning
System Learning Supports • Progress Monitoring • Data-Based Decision Making • Problem-Solving • Instructional Coaching • Professional Learning The Performance Gap / Instructional Core System Learning Supports Infrastructure Supports Current Supports Grade Level Expectations Demands Skills Years in School The University of Kansas Center for Research and Learning
Instructional Core • Motivation/Behavior Supports • Smarter Standards-Based Curriculum Planning • Engaging Instructional Materials& Activities • Student-Informed Teaching • Connected Courses & Coherent Learning • Continuum of Literacy Instruction The Performance Gap / Instructional Core System Learning Supports Infrastructure Supports Current Supports Grade Level Expectations Demands Skills Years in School The University of Kansas Center for Research and Learning
Problem Identification What is the Problem and Is it Significant? Problem Analysis Why is it happening? Plan Evaluation Did our plan work? Plan Development What shall we do about it? Problem Solving Process School Improvement Cycle http://www.ncrel.org/sdrs/school.htm Similarities?
School Improvement Activity • What are your current SI Goals? • What content is covered in the current professional development plan? • What problems or issues often come up at your school?
So...WHAT is RTI? 1. An eligibility process for determining if a student has a learning disability? 2. An opportunity to redress years of dissatisfaction with both special education and general education? We See IT as Both
Program vs. Framework • Response to Intervention (RtI) and School-wide Positive Behavior Support are not programs, but frameworks for designing and implementing proactive, preventative programming using data.
Who Do We Serve in a Problem-Solving Model? We identify: 1. Students with Basic Skills or Severe Literacy Deficits for Direct Service 2. Students without these Deficits who Need Indirect Service for Success in Content Area Courses
Screen and Monitor • Screening & Prediction • State Assessment • *Word/Passage Fluency • *Correct Word Sequencing • Progress Monitoring • Comprehension Measure • *Three Minute Maze Test *progressmonitoring.org (Espin et al.)
Secondary Intervention and Progress Monitoring • Research by S. Vaughn • Tier I: • Require Prof.Development for Content Teachers on Effective Practices in Reading and Comprehension of Academic Texts and Vocabulary/Concept Development
Intervention/PM continued • Tier II: • Teach Word Level Skills • More Intensive • Supplemental Instruction in Comprehension and Vocabulary • Facilitate Their Use in Tier 1 Activities
Possible Data Sources Activity • Brainstorm the potential data sources in your school… • Examples may include: • Dean Referrals, Tardies, Suspensions, Expulsions, Outside Placements, Drop Outs • Common Assessments, CBM, Yearly Progress Pro, Failure Rates
The High School Solution: Building Continuously Improving Tier 1 General Education Instruction ~5% ~15% Use of Teaching Routines and Learning Strategies (Kansas) Well-Designed Curriculum with a “Big Ideas” Focus or Ability to “Distill” Curriculum to Big Ideas Effective Secondary Classroom Management Study and Organizational Skills Curriculum Modification ~80% of Students
After Screening Then ask… Five important questions about literacy supports!
5 Key Questions • What happens for those students who are reading below the 4th grade level? • What is in place across a school staff to ensure that students will get the ‘critical’ content in spite of literacy skill? • What happens for students who know how to decode but can’t comprehend well? • What steps have been taken to ensure that powerful learning strategies are embedded across the curriculum? • What happens for students who have language problems?
Improving Content Area Instructionin General Education: WHAT? • Consider a Common • Scientifically Based Core Language Arts Program • Increase Access to • Strategic Instruction Model (SIM) • Build • Common Assessments in Content • Provide Staff Development Around • Effective Grading Systems • Train and Support School-Wide and Within the Class • Effective Behavior Support
all most some Increase the Capacity of General Education to Teach ALL Students Critical Content • All students learn critical content required in the core curriculumregardlessof literacy levels. • Teacherscompensate for limited literacy levels by using… • Explicit teaching routines, • Adaptations, and • Technology to promote content mastery. • For example: The Unit Organizer Routine
Key Skills Sets for Secondary Support(http://www.ku-crl.org/)
Content Enhancement Routines (Creating “learning-friendly” classrooms) • A way of teaching academically diverse classes in which… • The integrity of the content is maintained • Critical content is selected and transformed • Content is taught in an active partnership with students The University of Kansas Center for Research and Learning
Content Enhancement Teaching Routines Planning & Leading Learning Course Organizer Unit Organizer Lesson Organizer Exploring Text, Topics, & Details Framing Routine Survey Routine Clarifying Routine Ordering Routine Teaching Routines Concept Mastery Routine Concept Anchoring Routine Concept Comparison Routine Increasing Performance Quality Assignment Routine Question Exploration Routine Recall Enhancement Routine The University of Kansas Center for Research and Learning