
Investigation of Angular Acceleration in Spinning Objects Using Smart Pulley
In this experiment, a student records the motion of a spinning object and analyzes it using a smart pulley connected to the Pasco interface. The student creates a θ vs. time graph and derives the equation q(t) = At² + Bt + C, with parameters A = 6.50, B = 0.001, and C = 0.00. The angular acceleration is evaluated from this data, yielding a = 12.0 rad/s². The procedure involves collecting angular velocity and position measurements, fitting curves to the graphs, and calculating experimental accelerations (E1 and E2) to determine the percent difference and variations with free-fall motion.

Investigation of Angular Acceleration in Spinning Objects Using Smart Pulley
E N D
Presentation Transcript
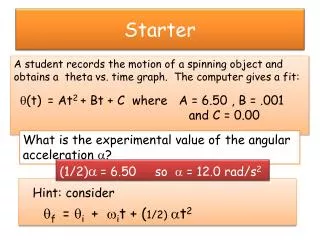
Starter A student records the motion of a spinning object and obtains a theta vs. time graph. The computer gives a fit: q(t)= At2 + Bt + C where A = 6.50 , B = .001 and C = 0.00 What is the experimental value of the angular acceleration a? (1/2)a= 6.50 so a = 12.0 rad/s2 Hint: consider qf = qi + wit + (1/2) at2
Practice Recall from the circular motion study that: qf= qi + wit + (1/2) at2 wf= wi + at You will investigate these relationships.
Procedure Connect the smart pulley to the Pasco interface. Start Data Studio. Select “ Create experiment”. Add the smart pulley sensor. On the 2nd measurement tab select “ angular velocity and angular position” using radian measure. Place a string and two weight hangers over the pulley as shown. Place a small piece of clay on one pulley. 7. Press collect and release the hangers.
Analysis Obtain a theta vs. time graph. Fit a curve to your graph and make a print out. Obtain a angular velocity vs. time graph. Fit a line to the graph and make a print out. Find the experimental acceleration from your theta vs. time graph. Call this value E1. D. Find the experimental acceleration from your w vs. time graph. Call this value E2. E. Find the % difference between your two E1 and E2.
Questions Write 1 or 2 paragraphs explaining the results ( your two graphs ) including an explanation of: 1. How you obtained the angular acceleration from each graph. 2. How the graphs compare to the y vs. t graph and v vs. t graph for free fall.
Lab Report Checklist Cover Sheet Two Graphs Both accelerations and the percent difference. Questions Summary
EXIT A student records the motion of a spinning object and obtains an w vs. time graph. The computer gives a fit: w(t)= At+ B where A = 8.50 and B = 1.00 What is the experimental value of the angular acceleration a?