Download
1 / 23
230 likes | 241 Vues
This presentation provides an overview of the 1972 Limits to Growth study and its relevance in the current climate situation. It discusses immediate and long-term actions that should be taken to address the challenges. The presentation also explores scenarios for the 21st century and emphasizes the importance of trying rather than giving up.

E N D
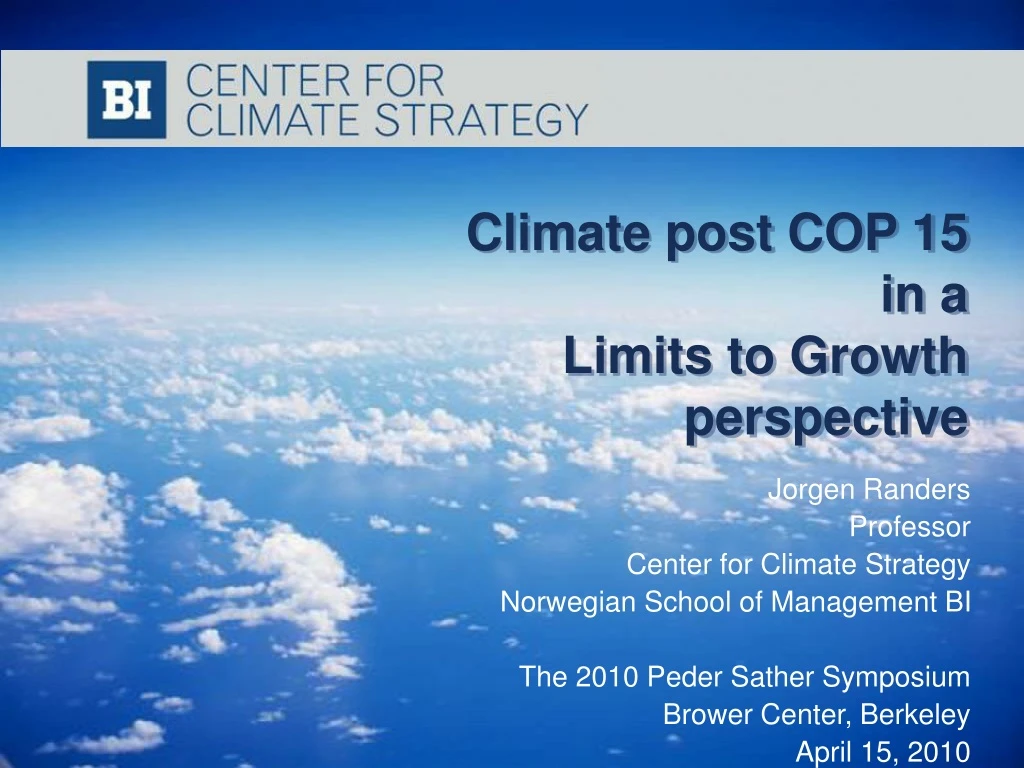
Climate post COP 15 in a Limits to Growth perspective Jorgen Randers Professor Center for Climate Strategy Norwegian School of Management BI The 2010 Peder Sather Symposium Brower Center, Berkeley April 15, 2010
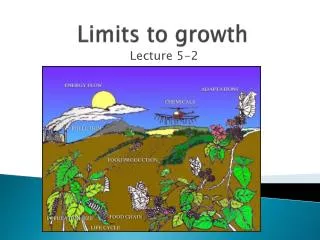
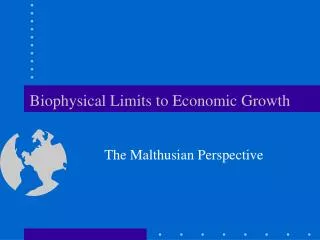
Overview What did The Limits to Growth study say in 1972? What has happened since? What is the current situation (in LTG perspective)? What should be done – immediately? What should be done in the longer run? Better to try than to give up
3: Industrial output 5: Nonrenewable resources 1 3 2 1 5 2: Food output 5 4 1: Population 1 2 3 2 1 5 2 5 3 4 4: Pollution level 3 4 4 0 1900 1950 2000 2050 Year 2100 Limits Scenario 1: Business as usual Source: Meadows, Randers and Meadows, LTG 30 year update, 2004
Decision making takes time COP 15 meeting in December 2009
Canadian catch of cod 1850 – 2003 (tons per year) Collapse does occur Source: GRID Arendal, Planet in Peril, 2004
LTG scenarios vs 30 years of data Source: Graham Turner, WP 2008-09, CSIRO, Sydney , June 2008
LTG scenarios vs 30 years of data Source: Graham Turner, WP 2008-09, CSIRO, Sydney , June 2008
PLANET EARTH The human ecological footprint 1961 – 03 BUILT- UP LAND NUCLEAR ENERGY ENERGY FISHING GROUNDS FOREST GRAZING LAND CROPLAND Source: Living Planet Report, WWF, 2006
Human CO2 emissions and its effect 400 300 200 100 0 Concentration in ppm Emissions in GtCo2/yr)
Temperature is going up Global average ocean and land Source: Jim Hansen, Climate threat to the Planet, Oslo 2009
Approaching peak oil? Source: www.theoildrum.com/tag/update
Decision making takes time COP 15 meeting in December 2009
Human CO2 emissions – necessary cut SUSTAINABLE ? 2050 2100
WWF solution in 2007 (+forest protection) 2 % per year growth in energy use Increased energy efficiency (yellow) More renewable energy (blue+green) Carbon capture and storage (brown) Source: Climate Solutions, WWF International, 2007
Faster decision-making? President Hu speaking in the great halll 2009
What to do? An end to overshoot through managed decline BAU Overshoot Towards sustainability Source: Mathis Wackernagel, 2010
Technology is advancing Source: World Bank, Commodities at the Crossroads, 2009
Proposed burden sharing (tCO2/person-yr) 2010: Industrial world starts cutting 5 %/yr 15 Industrial world 2025: China starts cutting 5 %/yr 10 Per capita emissions (tCO2 per person-yr) 5 2035: Rest of world starts cutting 5 %/yr China Rest of world 0 1950 2000 2050 2100 Source: Bjart Holtsmark, Statistics Norway.
Total emissions (GtCO2/yr - per region) 50 45 40 35 30 GtCO2 per year 25 20 Rest of world Industrial world 15 10 5 China 0 Source: Bjart Holtsmark, Statistics Norway. 1950 1975 2000 2025 2050 2075 2100
Incomes grow, but not happiness Data for the United States 1973 - 2004 Source: Clark et al, Journal of Economic Literature 2008, 46:1
Better to try than to give up! jorgen.randers@bi.no