Download
1 / 34
340 likes | 525 Vues
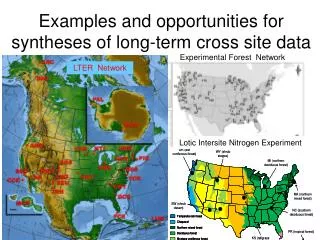
Experimental Forest Network. LTER Network. Examples and opportunities for syntheses of long-term cross site data. Lotic Intersite Nitrogen Experiment. Early Efforts in LTER Climate Committ ee 1986 Objectives. Establish baseline meteorological measurements Characterize each LTER site

E N D
Experimental Forest Network LTER Network Examples and opportunities for syntheses of long-term cross site data Lotic Intersite Nitrogen Experiment
Early Efforts in LTER Climate Committee 1986 Objectives • Establish baseline meteorological measurements • Characterize each LTER site • Enable intersite comparisons • Document both cyclic and long-term changes • Provide a detailed climatic history • Correlate with bio-ecological phenomena • Provide data for modeling
Climate and Hydrology Database harvester Objectives • Promote use of data for science, management and education • Maintain a currentdata warehouse of multi-site, multi-network, long-term climate and streamflow data • Provide critical background data in learning about and mitigating environmental change on the continental scale • Provide accessibility to data through a single portal • Provide a web interface to download, graphically display, and view data • Facilitate intersite science and foster development of multi-network datasets
ClimDB/HydroDB Web Pages Implemented in 2002 Funded provided by LTER and USFS Small amts of funding to sites to organize data into format for harvester Funding for programming of harvester http://www.fsl.orst.edu/hydrodb/
ClimDB and HydroDB 41 Sites • 24 LTER sites + 2 International LTER sites • 22 USFS sites • 12 sites include USGS gauging stations 327 Measurement Stations • 154 meteorological • 173 stream gauging (includes 65 USGS) 21 daily measurement parameters • Primarily streamflow, air temperature, precipitation Over 10 million daily values
ClimDB/HydroDBUser downloads by year: * Through 8-19-2009
Metadata categories about sites • Research Area Information • Watershed Spatial Characteristics • Watershed Ecological Characteristics • Watershed Descriptions • Hydrologic Gauging Station • Meteorological Station
Data Aggregation Rules • Values flagged with “Q” or “M” will not be included in monthly or yearly aggregation. Values tagged with “E” will be included. The number of valid values used in the aggregation will be displayed. Sites are encouraged to estimate data values rather than reporting questionable or missing data. • If all data values (e.g., data values listed in the header line) are all missing for a period of days, it is not necessary to “fill in” these periods with null data and “missing” flags. • Each field in the data is parsed and has its leading and trailing spaces removed before inspection. Then in this order these operations occur: • If a data value of 9999 is encountered, its flag will be forced to M. • If an invalid flag code is encountered, an error message will be logged and the record ignored. • If a data value of NULL (nothing) is encountered, the flag will be forced to M • If a flag value is G, the flag will be forced to NULL. • If a flag value is M, the data value will be forced to NULL, • In the case of precipitation, if the flag is T but the data value is NULL (e.g., blank), the flag will be forced to M and a warning message will be logged.
Data Acquisition Download or Graphical Display
More cross-site comparisons LTER Network
LTER ECOTRENDS EXAMPLE Lots more issues than expected Problem!
Interest in exploring stream chemistry responses to environmental gradients and land use change across continent
Beginning cross site synthesis of long-term stream biogeochemistry across 10 Experimental Forests
Current Experimental Forest Synthesis Database Design Chemistry parameters tables Data tables Sites Site web sites Contacts Site disclaimers & agreements Status of data Basins Disturbances Disturbance details Names Standardized methods Labs Equipment Methods Discharge Samples - instantaneous Chem data – instantaneous concentrations Samples – integrated & aggregated Chem data – integrated & aggregated concentrations Chem data – fluxes
Challenges Standardizing data & issues of comparability Preliminary List Of Analytes Standard units and nomenclature Methods Detection limits Time steps / aggregation methods
Chemistry data standardizationExamples of difficult issues Hierarchical parameter categories Importance of standard terminology Example: Total Nitrogen is ambiguous • Total Nitrogen (unfiltered) and • Total Dissolved Nitrogen chemistry databases can become unwieldy without organized parameters
Chemistry data standardizationExamples of difficult issues Converting to standard units Clear labels of original & standard units are important Example: NO3 (mg/L) is ambiguous • nitrate as nitrogen, NO3-N (mg N/L) • nitrate as nitrate, NO3 (mg NO3/L) Pre-population conversion vs. stored procedures to convert on the fly
Chemistry data standardizationExamples of difficult issues Detection Limits Documenting the detection limit of below detection values is important – different researchers /labs’ policies on reporting machine-read values below detection and detection limits vs. only reporting detection limits needs to be reconciled • a code indicating “below detection” is insufficient • treatment of historic data for which detection limits are unknown needs to be determined
Question driven, collaborative approach and harvester as a productSynthesis Papers and Products Topic 1: Informing national nutrient criteria using long term reference basin dataTopic 2: Examining effects of forest disturbance on stream chemistry dynamics, concentrations and fluxes Topic 3: Cross site comparison of effects of different calculations of fluxes Products: peer reviewed papers, metadata on sites and methods, databases structured to allow future cross site harvesting
Chem DBDeveloped from desire for cross site stream chemistry synthesisIdea to build on Clim/HydroDB harvester but with increasing complexity
HydroDesktop Hydrologic Information System (HIS) Observations GIS Models Climate Remote Sensing
Synthesis and Networks • Challenges involved in integrating legacy data • Planning for synthesis at the beginning easier • Importance and value of metadata • Automated data scripts to keep data current • Huge benefits and learning from comparing dynamics cross site
Opportunities for and syntheses of long-term cross site data
ClimDB Parameters • Air temperature; daily minimum, maximum, and mean in degrees Celsius (C) • Atmospheric pressure; daily mean in hectopascals (hPa) • Dewpoint temperature; daily mean in degrees Celsius (C) • Global solar radiation; daily total in MegaJoules per square meter (MJm-2) • Precipitation; daily total in millimeters (mm) • Relative humidity; daily mean in percent (%) • Snow depth (water equivalence); daily instantaneous observation in millimeters (mm of water). • Soil Moisture; daily mean in megapascals (MPa) • Soil temperature; daily mean in degrees Celsius (C) • Stream Discharge; daily mean in liters per second (l/sec) • Vapor pressure; daily mean in hectopascals (hPa) • Water Temperature; daily minimum, maximum, and mean in degrees Celsius (C) • Wind direction and resultant wind direction; daily mean in degrees azimuths (deg) • Wind speed and resultant wind speed; daily mean in meters per second (m/sec)