Absolute Value Functions: Graphing and Transformations
80 likes | 158 Vues
Learn how to graph absolute value functions, identify the vertex, plot points, and compare graphs with examples and guided practice.

Absolute Value Functions: Graphing and Transformations
E N D
Presentation Transcript
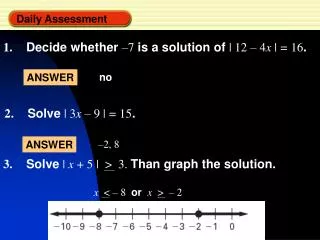
no ANSWER –2, 8 ANSWER x < – 8 or x > – 2 Daily Assessment 1. Decide whether –7 is a solution of | 12 – 4x |=16. 2. Solve | 3x – 9 |=15. 3. Solve | x + 5 | > 3. Than graph the solution.
2.4 Using Absolute Value Functions and Transformations
EXAMPLE 1 Graph a function of the form y=| x–h |+k Graph y=|x+4|–2. Compare the graph with the graph of y=|x |. SOLUTION STEP1 Identify and plot the vertex, (h, k)=(–4, –2). STEP2 Plot another point on the graph, such as (–2, 0). Use symmetry to plot a third point, (–6, 0).
Graph (a)y=|x| and (b) y =–3|x|. Compare each graph with the graph of y=|x|. • The graph of y=|x| is the graph of y=|x| • vertically shrunk by a factor of . The graph has • vertex (0, 0) and passes through (–4, 2) and (4, 2). 1 1 1 2 2 2 EXAMPLE 2 Graph functions of the form y=a |x| SOLUTION
To graph Absolute Value Functions • Identify the vertex. • Select another x. Substitute to find the y. • Plot the point. • Reflect across the axis of symmetry. • Repeat with another point.
Graph a function of the form y = a x – h + k Graph y = –2 x – 1 + 3. Compare the graph with the graph of y = x . The graph of y = – 2 x – 1 + 3 is the graph of y = xstretched vertically by a factor of 2, then reflected in the x-axis, and finally translated right 1unit and up 3 units. EXAMPLE 3 Identify and plot the vertex, (h, k) = (1, 3). Plot another point on the graph, such as (0, 1). Use symmetry to plot a third point, (2, 1).
2. y = |x| 1 4 for Examples 1, 2 and 3 GUIDED PRACTICE Graph the function. Compare the graph with the graph of y = |x|. 1.y = |x – 2| + 5 ANSWER The graph is shrunk vertically by a factor of The graph is translated right 2 units and up 5 units 1 4
for Examples 1, 2 and 3 GUIDED PRACTICE Graph the function. Compare the graph with the graph of y = |x|. 3. f (x) = – 3| x + 1| – 2 ANSWER The graph is reflected over the x-axis,stretched by a factor of 3, translated left 1 unit and down 2 units