Download

1 / 43
450 likes | 637 Vues
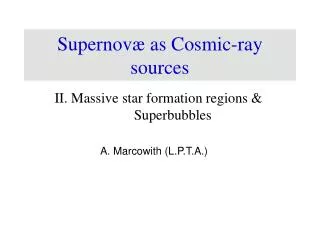
Massive Stars: Feedback Effects in the Local Universe. Sally Oey University of Michigan Cathie Clarke IoA, Cambridge. Smith et al. / MCELS. HDF. Massive Star Feedback. Smith et al. / MCELS. Radiative Mechanical Chemical. > 8 M o 3 – 40 Myr lifetimes.

E N D
Massive Stars:Feedback Effects in the Local Universe • Sally Oey • University of Michigan Cathie Clarke IoA, Cambridge Smith et al. / MCELS HDF
Massive Star Feedback Smith et al. / MCELS • Radiative • Mechanical • Chemical > 8 Mo 3 – 40 Myr lifetimes
THE MASSIVE STARPOPULATION Distributions: • N* : Clustering law, field • m :Stellar IMF NGC 346 Nota et al. 2006
The IMF Upper-mass cutoff IC 1805 24 Berkeley 86 10 NGC 7380 11 NGC 1893 19 NGC 2244 12 Tr 14 / 16 82 LH 10 65 LH 117 / 118 40 Total 263 R136a / 30 Dor > 650 Grand Total > 913 Massey et al. 1995 Observed OB associationsages < 3 Myr,m > 10 Mo Massey & Hunter 1998, Hunter et al. 1997 Arches: Figer 2002, 2005 R136a: Weidner & Kroupa 2004, Oey & Clarke 2005
mmaxexpectation value cf. Elmegreen (2000):Milky Way mup~10,000 Mo N* OB + 30 Dor OB’s impliesmup< 200 Mo Oey & Clarke (2005)
Entire sample Probabilities for mmaxassuming mup P < 0.002 P < 0.12 P < 0.02 P < 0.47 Oey & Clarke 2005 mup ~ 150 M8 see also Koen (2006)
A Universal Clustering Law HST / B. Whitmore Starbursts Meurer et al. 1995 Globulars and Massive young Clusters Elmegreen & Efremov 1997, Hunter et al. 2003 Antennae Zhang & Fall 1999 -1.95 +/- 0.03 -2.00 +/- 0.08
a Universal Clustering Law and a Universal IMF ? Field stars fall on clustering law All -2.51 +/- 0.29 No field -2.27 +/- 0.38 SMC Oey, King, & Parker 2004 A steep field IMF a steepening N* (fewer massive) (more low-N*) Massey (1995, 2002); Kroupa & Weidner (2003)
Fraction of Field Massive Stars: 35% to 7% for N*,up = 10 to 106 SMC: expect ~20%, see ~26% modest dependence on total SFR Oey, King, & Parker 2004
RADIATIVE FEEDBACK Nebular emission • HII Region LF • Diffuse, warm ionized medium Large Magellanic Cloud MCELS Smith et al. 2006 Ha, [S II], [O III], V, R
HII Region Luminosity Function log N(L) • Break in slope • Arm populations: shallower a Interarm populations: steeper a • Hubble Type correlation a ~ 1.7 Sc – Im a ~ 2.0 Sb – Sc a ~ 2.6 Sa log L a Universal Clustering Law and a Universal IMF ? Oey & Clarke 1998
Ionization of the Diffuse WIM HaMilky Way WHAM: Reynolds et al. Field stars: ~ 50% WIM ionized by fieldOey et al. 2004; Hoopes & Walterbos 2000 Leaky nebulae: LMC: up to 50% ionizing photons escape Oey & Kennicutt 1997; Gerken, Walterbos, & Oey 2003
MECHANICAL FEEDBACK Small Magellanic Cloud Staveley-Smith et al. 1997 H I DEM L152 R. C. Smith & MCELS Ha, [S II], [O III] ~100 pc diameter
Superbubble size distribution Global Mechanical Feedback clustering law + + = Oey & Clarke 1997
Oey & Clarke 1997 Size distribution Predicted -2.8 +/- 0.4 Observed -2.7 +/- 0.6 Oey & Clarke 1998 prediction observed Velocity distribution Predicted -3.5 Observed -2.9 +/- 1.4
Ionizing photons escape into ISM? ...into IGM? Reionization of Universe? Escape of hot gas, stellar products and ionizing photons?
Clarke & Oey 2003 Critical SF Threshold MW: Ambiguous porosity e.g., Oey & Clarke 1997 Starbursts: Lyman cont seen in Haro 11 Bergvall et al. 2006 LBGs: Lyman cont seen? Steidel et al. 2001 The first galaxies: ?
SINGG: Survey of Ionization in Neutral Gas Galaxies Ha survey of HIPASS galaxies Meurer et al. (2006) ESO 300-G14 IC 5052 NGC 7713 Ha R-band Oey et al. (2006, in prep)
Possible causes for high SFI : less WIM • Ionization source reduced: • Output from HII regions reduced • Fewer field OB stars • Starbursts occupy ISM and Remaining WIM density-bounded Ionizing photons escape
Fraction of Field Massive Stars: recall 35% to 7% for N*,up = 10 to 106 SMC: expect ~20%, see ~26% modest dependence on total SFR Oey, King, & Parker 2004
recall Clarke & Oey 2003 Critical SF Threshold MW: Ambiguous porosity e.g., Oey & Clarke 1997 J0355-42 Starbursts: LBGs: Lyman cont seen e.g., Steidel et al. 2001
Possible causes for high SFI : less WIM • Ionization source reduced: • Output from HII regions reduced • Fewer field OB stars • Starbursts occupy ISM and Remaining WIM density-bounded ? Likely LyC seen from Haro 11 Bergvall et al. 2006 Ionizing photons escape
Oey 2000, 2003 CHEMICAL FEEDBACK Q: filling factor n: generations Stochastic Inhomogeneous evolution
Halo MDF Thick disk MDF Bensby & Oey (2006), in prep Thick disk MDF Thin disk MDF (Oey 2003) data:Carney et al. (1996) Simple: Halo is evolved SIM: Halo is unevolved data: Nordstrom et al. (2004) selection: Bensby et al. (2003, 2005)
Zero-metallicity (Pop III) stars (Oey 2003) For Galactic halo modelFIII ~ 4e-2 vs.Observed FIII< 4e-4 Clear discrepancy!
OB clustering H II LF, WIM Superbubbles Massive Star Feedback Field fraction: mup ~ 150 Mo ionizing WIM, IGM relation to IMF ISM structure, evolution
A self-consistent analytic approach Superwind threshold Metal enrichment starburst feedback to IGM Simple Inhomogeneous Model GCE of unevolved systems
Massive Star Feedback • OB population: clustering law, IMF • Radiative: HII LF, diffuse 104 K gas • Mechanical: superbubbles, superwinds diffuse 106 – 107 K gas • Chemical: inhomogeneous chemical evolution
Adiabatic shell evolution L = mech luminosity n = ambient density t = age
Galaxy Q M31 M33 LMC SMC IC 10 LG dwarfs Milky Way (HII LF) Milky Way (SN rate) 0.03 0.3 1.0 0.3 23 0.01 – 0.2 0.2 ~ 1 volume filling factor of hot ISM Porosity: Hot, ionized medium clusteringb = 2 Mac Low & McCray (1988) superwind mass-loss rate Oey & Clarke 1997, Oey et al. 2002
(Clarke & Oey 2002) Starbursts Distributed vs Nuclear • He 2-10: Chandar et al. 2003 • Field population = SSC’s • LF L-2 • Field OB’s formed in situ Equal contrib to porosity by all superbubble R Oey & Clarke 1997
R136a / 30 Dor Consistent with no mup Massey & Hunter 1998; Massey 2003 Suggestsmup~ 150 Mo Selman et al. 1999 Consistent with Salpeter slope If no mup: 1.7x N*(85 – 120 Mo) Expect (14, 19) having m > 120 Mo Found (2, 9) stars Massey & Hunter 1998 (See also Weidner & Kroupa 2004)
Oey & Clarke 1998 zero-age evolved Monte Carlo model
CHEMICAL FEEDBACK Nucleosynthesis Chemical evolution • MIXING : local • HOMOGENIZATION : global • IN/OUT-FLOW : open box
Simple Inhomogeneous Model (Oey 2000, 2003) Q: filling factor = const n: generations Early times: Stochastic Inhomogeneous evolution
Parent metallicity distribution function Multi-generation
Inhomogeneous evolution: Dispersion Audouze & Silk (1995) Thin disk:Oey & Bensby -4.0 -3.0 -2.0 [Fe/H] Argast et al. (2000)
Cayrel et al. (2005) McWilliam (1997)
Evolution parameter: nQ n = 4 Q = 0.72 n = 24 Q = 0.72 n = 24 Q = 0.12 mtl-rich + old: high Q e.g.,Bulge mtl-poor + old: low Q e.g.,I Zw 18 m = nQ s2= nQ(1-Q)