Why does the abundance of Erica tetralix decrease on wet heathlands?
Why does the abundance of Erica tetralix decrease on wet heathlands?. Christian Damgaard Aarhus University. Why does the abundance of Erica tetralix decrease on wet heathlands?. Erica tetralix, which is the characteristic species of wet heathlands, is decreasing in abundance

Why does the abundance of Erica tetralix decrease on wet heathlands?
E N D
Presentation Transcript
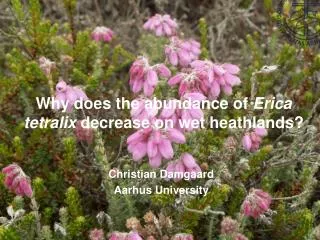
Why does the abundance of Erica tetralix decrease on wet heathlands? Christian Damgaard Aarhus University
Why does the abundance of Erica tetralix decrease on wet heathlands? Erica tetralix, which is the characteristic species of wet heathlands, is decreasing in abundance We are unsure what is causing this change and what management actions are needed to reverse the change Until now we have only been able to explore the phenomenon using monitoring data
The Danish monitoring programe NOVANA was initiated as a response to the EU-Habitat directive with the objective to: Describe sources of pollution and other pressures and their effects on the status and trend regarding terrestrial natural habitats Document the overall effect of national action plans and measures directed at terrestrial natural habitats – including whether the objectives are attained, and whether the trend is in the desired direction Help fulfill Denmark’s obligations under EU legislation, international conventions and national legislation Help strengthen the scientific foundation for future international measures, national action plans, regional administration and other measures to improve terrestrial natural habitats, including helping to develop various tools Monitoring of Danish terrestrial habitats
Hierarchical sampling: 768 sites from 28 different terrestrial habitat types 18 open habitat types (dune, heath, grassland, bogs, …) 10 forest types At each site 20 – 60 randomly positioned plots. the plots at some stations are revisited with GPS accuracy Several variables are measured at the plot plant cover (pin-point) soil pH … Danish monitoring program (NOVANA)
Plot 0.5x0.5 m: Cover of plant species (pin-point) pH in soil/water Conductivity C/N - ratio Phosphorous Nitrate in soil/water N in shoots, mosses and lichens 5 m circle: Presence of other species Vegetation height Cover of woody species Grazing or moving Gaps in vegetation/bare soil/sand Cover of plants affected by herbivory Hollows in bog structure NOVANA - measurements
Objective method for measuring plant cover Place a frame with a grid pattern A pin is inserted vertically through one of the grid points into the vegetation The pin will typically touch a number of plants and the different species are recorded This procedure is repeated for each grid point The pin-point (point-intercept) method
The distribution of plant cover is modelled using a generalised binomial distribution with two parameters q : mean plant cover d : intra-plot correlation The probability density function of the generalised binomial distribution (=Pólya-Eggenberger distribution) is equal to the beta-binomial mixture distribution but is somewhat more general in that negative intra-plot correlation is allowed (Qu et al. 1993) Distribution of pin-point cover data within a site
Generalised binomial distribution q : mean cover at the site d : intra-plot correlation
Framework for analysing trends of hierarchical plant cover data has been developed Bayesian state-space model Separation of process and sampling error Efficient treatment of missing values Effect of treatment or co-variable on change in cover Possible to account for auto-correlation Ecology 93(6), 2012, pp. 1269–1274 Analysing trends in plant cover
Separation of process and sampling variance • Process equation (solid error) • Dxi =a + eiei ~ Normal(0,sp2) • Measurement equation (dashed error) • yi,j ~ Generalised Binomial Distribution (n, xi, d)
Erica tetralix - among site-variation Although Erica tetralix is the characteristic species of wet heathlands there is a large among-site variation in cover (Damgaard, submitted)
Is the cover of Erica tetralix regulated by nitrogen deposition or pH or both?
SEM of hierarchical data • The site means are modelled by latent variables • Nitrogen deposition (model calculated) and pH (measured in the top soil) are assumed to be normally distributed • The pin-point cover measures of E. tetralix are assumed to distributed according to a generalised binomial distribution • Important to include the effect of inter-specific aggregation!! • The model is parameterised using a Bayesian MCMC approach
Is the cover of Erica tetralix regulated by nitrogen deposition or pH or both?
Why does the abundance of Erica tetralix decrease on wet heathlands? We are keen to investigate the causal relationships using experimental manipulations Observation: Erica tetralix seems to be dying due to toxicity - not outcompeted (Strandberg et al. 2012) Working hypothesis: soil with low pH in combination with low base cation concentrations reach toxic levels under certain environmental conditions