
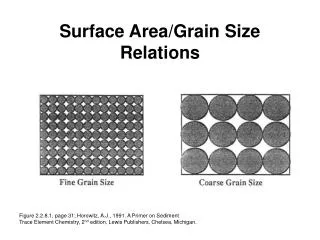
Surface Area/Grain Size Relations
Surface Area/Grain Size Relations. Figure 2.2.8.1, page 31; Horowitz, A.J., 1991. A Primer on Sediment Trace Element Chemistry, 2 nd edition, Lewis Publishers, Chelsea, Michigan. Forstner, U, and Witmann, GTW. Figure 39a and b. page 127. Metal Pollution in the

Surface Area/Grain Size Relations
E N D
Presentation Transcript
Surface Area/Grain Size Relations Figure 2.2.8.1, page 31; Horowitz, A.J., 1991. A Primer on Sediment Trace Element Chemistry, 2nd edition, Lewis Publishers, Chelsea, Michigan.
Forstner, U, and Witmann, GTW. Figure 39a and b. page 127. Metal Pollution in the Aquatic Environment; Springer Verlag, Berlin.
Changes in Surface Area as aFunction of Grain Size Table from Horowitz, 1991; data from Jackson, 1979
Influence of Grain Mineralogy on Surface Area Table from Horowitz, 1991; data fromForstner and Wittmann, 1981
Influence of Coatings on Surface Area • Sand-sized and Larger seds.: grain coatings composed of carbonates, Fe & Mn oxides and hydroxides, and organic matter are rough in comparison to surface of the underlying particles. • Coatings may comprise <5% by weight, but account for significant portion of the total surface area. • Silt and clays sized particles: coatings fill in surface irregularities. Also, cement grains together, creating larger agglomerated grains. Combination of processes reduces surface area. Based on Horowitz and Elrick, 1987
Grain Size vs. Concentration • Semi-systematic increase in concentration with finer-grained material • Decrease in conc. In finest fraction due to coatings, composition, and agglomeration of grains • Increase in fine sand due to dentrital minerals. Also to influx of metal enriched sediments from pollutant sources. Forstner, U, and Witmann, GTW. Figure 36. page 123. Metal Pollution in the Aquatic Environment; Springer Verlag, Berlin.
Grain Size vs. Concentration Data from Forstner and Wittman, 1979
Concentration vs. Quantity of Fine Sediment • Sizes Frequently Used • 16 μm • 62.5 μm • 63 μm • 125 μm Data from deGroot et al., 1982
Metals per unit Mass • Some deposits may contain so little fine-grained material that the bulk of the metal contaminant per unit mass is found in the sand-sized fraction.
Reno Fallon Lahontan Reservoir Virginia i l M e City x C i a 95 Fort S n y o Table n Churchill 15 Six Mile Mtn. 11 18 Canyon Fan 14 13 16 17 9 10 Mineral 7C 12 Canyon 7D Gaging Station Gold Canyon 7B 7 6 Dayton 5 4 Pyramid 3 Lake 2B Canyon (Brunswick) Carson 2 City T Carson 1B r u Playa c k e Stillwater e 1 R Wildlife . . R Refuge n o s r a C 395 0 . R Gaging Lahontan e e k c station Carson Reservoir u r Lake T . . R Lake n o Carson River s Tahoe r a C Watershed Boundary Carson City k r o F E a t s s t e 0 1 2 3 4 5 W Miles F F o 0 1 2 3 4 Km o r r k k SIERRA NEVADA Nevada California
Reno Fallon Lahontan Reservoir Virginia i l M e City x C i a 95 Fort S n y o Table n Churchill 15 Six Mile Mtn. 11 18 Canyon Fan 14 13 16 17 9 10 Mineral 7C 12 Canyon 7D Gaging Station Gold Canyon 7B 7 6 Dayton 5 4 Pyramid 3 Lake 2B Canyon (Brunswick) Carson 2 City T Carson 1B r u Playa c k e Stillwater e 1 R Wildlife . . R Refuge n o s r a C 395 0 . R Gaging Lahontan e e k c station Carson Reservoir u r Lake T . . R Lake n o Carson River s Tahoe r a C Watershed Boundary Carson City k r o F E a t s s t e 0 1 2 3 4 5 W Miles F F o 0 1 2 3 4 Km o r r k k SIERRA NEVADA Nevada California
Fractional Contributions of Selected Metals in Suspended Sediments (modified from Horowitz et al., 1990)