Download
1 / 21
210 likes | 276 Vues
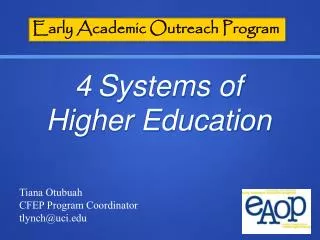
Patrick Kelly National Center for Higher Education Management Systems. Making Place Matter. October 29, 2009. The National Goal. “By 2020, America will once again have the highest proportion of college graduates in the world” President Obama, February 24, 2009.

E N D
Patrick KellyNational Center for Higher Education Management Systems Making Place Matter October 29, 2009
The National Goal “By 2020, America will once again have the highest proportion of college graduates in the world” President Obama, February 24, 2009
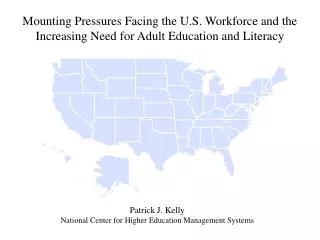
Educational Attainment and Personal Income $50,000 1980 $43,000 $36,000 AK Personal Income Per Capita CT $29,000 CA NV WY NJ HI MD NY IL CO WA DE MA MN VA US OR PA MI OH WI KS FL NH RI TX IA AZ OK IN MO $22,000 NE MT LA VT UT ID GA ME NM TN NC WV Correlation = 0.64 KY SD ND AL SC AR MS $15,000 10 15 20 25 30 35 40 45 Percent of Adults 25 to 64 with Bachelors Degrees
Educational Attainment and Personal Income $50,000 1990 $43,000 CT NJ $36,000 NY MA Personal Income Per Capita MD AK HI CA DE IL NH VA NV MN RI WA CO PA FL $29,000 US OH MI KS WI WY NE OR VT MO GA IN IA ME NC AZ TX TN OK SD ND SC AL ID MT KY LA UT NM $22,000 WV AR MS Correlation = 0.76 $15,000 10 15 20 25 30 35 40 45 Percent of Adults 25 to 64 with Bachelors Degrees
Educational Attainment and Personal Income $50,000 2000 CT NJ $43,000 MA NY MD CO NH CA MN IL $36,000 WA VA DE NV Personal Income Per Capita AK US PA RI MI FL WY WI HI OH OR GA TX KS VT NE MO IN NC IA ME TN SD $29,000 AZ ND SC OK KY UT ID AL LA MT NM WV AR MS $22,000 Correlation = 0.80 $15,000 10 15 20 25 30 35 40 45 Percent of Adults 25 to 64 with Bachelors Degrees
Educational Attainment and Personal Income $50,000 2005 CT NJ MA $43,000 MD NY NH CO MN VA WY DE CA IL $36,000 NV AK WA RI PA US HI Personal Income Per Capita FL WI NE KS VT SD OR MI TX OH IA ND MO IN NC GA ME TN AZ OK AL $29,000 MT SC ID KY NM UT AR WV MS LA $22,000 Correlation = 0.83 $15,000 10 15 20 25 30 35 40 45 Percent of Adults 25 to 64 with Bachelors Degrees
Oklahoma Regions for “Making Place Matter” Data 13 1 5 12 11 1. Northwest/Panhandle 2. Southwest 3. South Central/Lawton 4. El Reno/Chickasha 5. Enid/Ponca City 6. Oklahoma City Metro 7. Guthrie/Shawnee 8. Norman/Moore 9. Southern 10.Osage/Stillwater/Seminole 11. Tulsa County 12. Rogers/Waggoner 13. Northeast 14. Eastern 15. Southeast 10 7 14 6 2 8 4 3 15 9 U.S. Census Bureau’s Public Use Microdata Samples
Northeastern State University – Counties that Account for 80% of In-State First-Time Students (Fall 2008) Woods Ottawa Harper Grant Kay Nowata Craig Cimarron Texas Beaver Alfalfa Washington Osage Woodward Delaware Rogers Garfield Noble Pawnee Mayes Major Ellis Tulsa Payne Dewey Adair Wagoner Kingfisher Logan Creek Cherokee Blaine Lincoln Okmulgee Muskogee Roger Mills Custer Oklahoma Canadian Okfuskee Sequoyah Mcintosh Washita Cleveland Beckham Seminole Caddo Haskell Pottawatomie Grady Hughes Pittsburg Mcclain Greer Latimer Le Flore Kiowa Harmon Pontotoc Garvin Comanche Coal Jackson Stephens Murray Pushmataha Tillman Atoka Johnston Cotton Carter Jefferson Mccurtain Choctaw Marshall Love Bryan Source: Oklahoma State Regents for Higher Education
Educational Attainment of 18 to 24 Year Olds, 2005-07 Source: U.S. Census Bureau, 2005-07 American Community Survey (ACS) Three-Year Public Use Microdata Sample (PUMS) File.
Educational Attainment of 25 to 64 Year Olds, 2005-07 Source: U.S. Census Bureau, 2005-07 American Community Survey (ACS) Three-Year Public Use Microdata Sample (PUMS) File.
Educational Attainment (%) of 25 to 64 Year Olds by Race/Ethnicity, 2005-07 (Eastern Region) Source: U.S. Census Bureau, 2005-07 American Community Survey (ACS) Three-Year Public Use Microdata Sample (PUMS) File.
University in Missouri – Racial/Ethnic Representation of a Public Four-Year University’s Target Population: Participation, Completion, and Graduation Rates White African-American Hispanic Target Populations Participation and Completion Cohort Graduation Rate High School % 18-24 Year First-Time All Other Bachelors Degrees Graduation Rates Graduates, 2001- Olds with Just a Freshman, Fall Undergraduates, Awarded 2004-05 (Completers within 2002 (Service High School 2005 (Institution) Fall 2005 (Institution) 150% of Program Area) Diploma or (Institution) Time), 2005 Equivalent, 2000 (Institution) (Service Area) Sources: NCES: Common Core Data; IPEDS Enrollment, Completions, and Graduation Rate Surveys, U.S. Census Bureau
The Circular Argument Degree Production The current industry base has shortages that need to be filled in certain areas. But overall workforce demand may not call for that many more college graduates. A more educated citizenry leads to more entrepreneurship, small business development, and ability to attract outside business. Workforce Demand Economic Strength A stronger economy creates more demand for educated workers. Note: The above ignores all of the other benefits associated with an educated population – larger tax base, better health, greater civic engagement, fewer incarcerations, etc.
Percentage Employment by Industry, 2005-07 Source: U.S. Census Bureau, 2005-07 American Community Survey (ACS) Three-Year File.
Percentage Employment by Occupation, 2005-07 Source: U.S. Census Bureau, 2005-07 American Community Survey (ACS) Three-Year File.
Median Earnings by Degree-Level, 2005-07 Source: U.S. Census Bureau, 2005-07 American Community Survey (ACS) Three-Year Public Use Microdata Sample (PUMS) File.
Increase in Earnings from a High School Diploma to a College Degree, 2005-07 Source: U.S. Census Bureau, 2005-07 American Community Survey (ACS) Three-Year Public Use Microdata Sample (PUMS) File.
Average Annual Net Migration by Degree-Level (2005-2007) 22-64 Year Olds (Eastern Region) Bachelors Degree or Higher Source: U.S. Census Bureau, 2005-07 American Community Survey (ACS) Three-Year Public Use Microdata Sample (PUMS) File.
Age 16+ Average Annual Migration by Occupation Group, 2005-07(Eastern Region) Management & Professional Source: U.S. Census Bureau, 2005-07 American Community Survey (ACS) Three-Year Public Use Microdata Sample (PUMS) File.
Patrick Kelly NCHEMS patrick@nchems.org