Fast Spectrum Allocation in Coordinated Dynamic Spectrum Access Based Cellular Networks
260 likes | 491 Vues
Fast Spectrum Allocation in Coordinated Dynamic Spectrum Access Based Cellular Networks. Anand Prabhu Subramanian, Himanshu Gupta, Samir R. Das State University of New York at Stony Brook Milind M. Buddhikot Alcatel-Lucent Bell Labs DySPAN 2008. 1. 1. Outline. Introduction

Fast Spectrum Allocation in Coordinated Dynamic Spectrum Access Based Cellular Networks
E N D
Presentation Transcript
Fast Spectrum Allocation in Coordinated DynamicSpectrum Access Based Cellular Networks Anand Prabhu Subramanian, Himanshu Gupta, Samir R. Das State University of New York at Stony Brook Milind M. Buddhikot Alcatel-Lucent Bell Labs DySPAN 2008 1 1
Outline • Introduction • Model Description • Maximum Demands Serviced Dynamic Spectrum Access (Max-Demand DSA) • Minimum Interference Dynamic Spectrum Access (Min-Interference DSA) • Performance Evaluation • Conclusions 2 2
Introduction (1) • Measurement studies have shown that the cellular spectrum is highly utilized but the spectrum utilization varies dramatically over space and time [3–5] • Cellular networks will continue to evolve to higher access speeds and therefore, will require larger amount of spectrum • However, releasing more spectrum using current long-term command-and-control model of spectrum licensing is a flawed approach [3] Shared Spectrum, Inc. (2006). [Online]. Available: http://www.sharedspectrum.com/?section=measurements [4] M. A. McHenry, P. A. Tenhula, D. McCloskey, D. Roberson, and C. Wood, “Chicago Spectrum Occupancy Measurements and Analysis and a Long-term Proposal,” in First Workshop on Technology and Policy for Accessing Spectrum (TAPAS 2006), August 2006. [5] T. Kamakaris, M. M. Buddhikot, and R. Iyer, “A Case for Coordinated Dynamic Spectrum Access in Cellular Networks,” in Proceedings of IEEE DySPAN05, Baltimore,Maryland, November 2005.
Introduction (2) • Buddhikot et al. proposed a concept of Coordinated Dynamic Spectrum Access (CDSA) for cellular networks to enable capacity-on-demand services [5, 7, 8] • A centralized spectrum broker coordinates access to spectrum in a given region and assigns short term spectrum leases to competing radio infrastructure providers • One of the main challenges in building such brokers is the design of fast spectrum allocation algorithms [7] M. M. Buddhikot, P. Kolodzy, S. Miller, K. Ryan, and J. Evans, “DIMSUMnet: New directions in wireless networking using coordinated dynamic spectrum access,” in Proceedings of IEEE WoWMoM 2005, June 2005. [8] M. M. Buddhikot and K. Ryan, “Spectrum management in coordinated dynamic spectrum access based cellular networks,” in Proceedings of IEEE DySPAN05, Baltimore,Maryland, November 2005
Contributions • Formulate the spectrum allocation problem as two optimization problems • Max-Demand DSA: with the objective of maximizing the overall spectrum demands satisfied among various base stations such that no two interfering base stations that belong to different radio infrastructure providers are assigned the same channels • Min-Interference DSA: with the objective of minimizing the overall interference in the network when all the demands of the base stations are satisfied • Propose a graph construct called interference graph that captures conflict relationships between transmitters of various radio infrastructure providers that co-exist in a region • Develop constant factor approximation algorithms for the Max-Demand DSA problem and Min-Interference DSA problem
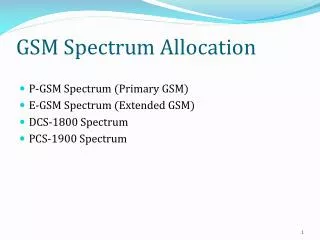
Model Description (1) • We designate the smallest amount of contiguous spectrum that can be requested via CDSA as a channel of C units • If the broker manages a spectrum band of B units, it can dynamically allocate K = B/C channels • Each spectrum demand request for a base station is specified as a range between dmin and dmax channels • We assume a batched spectrum request processing model • the spectrum demands received in a time window of τ units are grouped and processed together • the allocated spectrum is used in subsequent time windows
Model Description (2) • In this model, a part of the spectrum, designated as the Coordinated Access Band (CAB), is meant to be dynamically shared under the control of a spectrum broker • Each region R, which is under the control of a spectrum broker can have a number of base stations (nodes) owned by several Radio Infrastructure Providers(RIPs) • The Wireless Service Providers (WSPs) who offer wireless services such as voice, data etc. to the end users are customers of these RIPs and may use different RIPs in different regions and at different times • The network elements such as the Radio Network Controllers (RNCs) that control the base stations aggregate the end user demands and generate a spectrum demand request to the spectrum broker
Interference Graph • The networks of various RIPs in the region R controlled by the spectrum broker are modeled as a weighted undirected graph called the interference graph G =(V,E) • each base station is represented by a node in the graph • There is an edge (i, j) ∈ E between nodes i and j, if the base stations represented by them belong to different RIPs and interfere with each other • Each edge (i, j) ∈ E has a weight pijassociated with it which is the penalty when nodes i and j are assigned the same channels
Maximum Demands Serviced Dynamic Spectrum Access (Max-Demand DSA) • The objective of Max-Demand DSA is to maximize the overall demand serviced such that no two base stations belonging to different service providers that interfere with each other are assigned same channels
Relationship with Maximum K-Colorable Induced Subgraph (Max K-CIS) Problem • Definition of Max K-CIS: • Given a graph G =(V,E) and an integer K, find a K-colorable subgraph of G with the maximum number of vertices • Reduction • assume the minimum demands of each node is 0 • given the interference graph G(V,E), create a new graph Gmax =(Vmax, Emax) such that for each node i ∈ V , we create dmax(i) copies of it in Vmax and form a clique among those nodes • for each edge (i, j) ∈ E, add to Emax an edge from each copy of node i to each copy of node j • color a node in Gmax means we are servicing one demand of a base station
Maximum Independent Set Problem (Max-IS) • Definition of Max-IS: • find a set of vertices of maximum cardinality such that no two vertices have an edge between them • It can be shown that approximating the Max K-CIS problem is as hard as approximating the Max-IS problem for any fixed value of K [14] • A solution to the Max-K-CIS problem can be obtained by • repeating the Max-IS algorithm K times • removing the nodes in independent set formed from the graph in every iteration [14] D. S. Hochbaum, Approximation algorithms for NP-hard problems. Boston, MA, USA: PWS Publishing Co., 1997
δ-degree Bounded Graph • The Max-K-CIS problem is hard to approximate in general graphs • we use a δ-degree bounded graph to model the interference graph • Definition • A graph G =(V,E) is said to be δ-degree bounded, if the maximum node degree of any node in G is less than or equal to δ • Considering the sparse nature of deployment of base stations, a δ-degree bounded graph capture the characteristics of a realistic cellular network quite well
Max-IS algorithm • Algorithm 1. Pick a node i ∈ V such that the maximum independent set in the induced subgraph in the neighborhood of i is minimum among all nodes 2. Add i to the solution IS and remove i and all its neighbors from V 3. Repeat step 1 and 2 until all vertices in V are removed from the graph
Max-Demand DSA Algorithm (1) • Phase I: • Given the interference graph G =(V,E), create a new graph Gmin =(Vmin,Emin) • each node i ∈ V , we create dmin(i) copies of it in Vmin and form a clique among those nodes • For each edge (i, j) ∈ E, we add an edge from each copy of node i to each copy of node j to Emin • Try to color the nodes of graph Gmin using K colors by solving the Max-K-CIS problem in graph Gmin • the Max-K-CIS problem can be solved by repeatingMax-IS algorithm K times
Max-Demand DSA Algorithm (2) • Phase II: • Add extra copies (dmax(i) − dmin(i)) of each node i ∈ V to the already colored graph Gmin to form the new graph Gmax • Solve the Max-K-CIS problem in Gmax to color as many extra vertices as possible using the K colors
Minimum Interference Dynamic Spectrum Access (Min-Interference DSA) • The objective of Min-Interference DSA is to minimize the overall interference in the network when all the demands (dmax) of the base stations are serviced
Relationship with Max-K-Cut Problem • Definition of Max-K-Cut: • Given a graph G =(V, E), find a K-partitioning of the vertex set V, such that the number of edges that have their endpoints in different partitions is maximized • The weighted Max-K-Cut problem • partition the vertex set such that the sum of the weights of the edges whose endpoints are in different partitions is maximized • Reduction • assume the maximum demand of each node to be 1 • our problem boils down to assigning one of the K colors to each node such that the sum of the weights (pij’s) of the monochromatic edges is minimized • monochromatic edges: edges with endpoints assigned the same color
Multi-Color Max-K-Cut Problem • Definition of Multi-Color Max-K-Cut: • Given the weighted interference graph G = (V,E) with demands dmax(i) for each node i ∈ V and the total number of colors K • Assign dmax(i) different colors to each node i such that the sum of the weights of the non-monochromatic edges is maximized • i.e. maximize • where F(i) is the set of colors assigned to i and F(j) is the set of colors assigned to j
RkAlgorithm • The Rk (random) algorithm: • For each node i, randomly pick dmax(i) different colors from the available K colors and assign them to node i • Each color is expected to be in F(i) with a probability of dmax(i)/K • The probability of any particular color being in F(i) as well as F(j) is dmax(i)dmax(j)/K2 • The expected value of (|F(i) ∩ F(j)|) is dmax(i)dmax(j)/K • The expected value of the Rk solution is
Tabu Search Algorithm for Min-Interference DSA (1) • Tabu search [20] based heuristic • starts with the random solution obtained by algorithm Rk • improves the solution to get a better solution for the Min-Interference DSA problem • Algorithm • Start with a random initial solution F0wherein each node i ∈ V is assigned to dmax(i) different random colors in κ • In the lth iteration (l ≥ 0), we create the next solution Fl+1 in the sequence (from Fl) [20] A. Hertz and D. de Werra, “Using tabu search techniques for graph coloring,” Computing, vol. 39, no. 4, 1987
Tabu Search Algorithm for Min-Interference DSA (2) • The lth Iteration • First, we generate a certain number (say, r) of random neighboring solutions of Fl • a random neighboring solution of Fl is generated by picking a random vertex i ∈ V and a color in Fl(i) and changing it to a random color in (K−{Fl(i)}) • generate 100 neighboring solutions in each iteration • Pick the neighboring solution with the lowest network interference as the next solution Fl+1 • Termination • Keep track of the best solution Fbest seen so far • Terminate the algorithm when the maximum number of allowed iterations have passed without any improvement in I(Fbest)
Simulation Environment • Graph Parameters • 1000 nodes in the network randomly assigned to 10 service providers • Each node has a transmission range of 150m • Two nodes have an edge between them, if they belong to different service providers and are within 300m from each other • We generated graphs of different densities by randomly placing the 1000 nodes in a fixed area of size
Performance of Max-Demand DSA • We used four sets of demands • In the first set, the minimum demand of each node was randomly picked from 1 to 10 and the maximum demand for each node was randomly picked from 10 to 20 • Similarly we used the values (20,40),(30,60) and (40,80) for the other three sets of demands maximum node degree 10
Performance of Min-Interference DSA • We used four sets of demands • In the first set of demands, each node picks a value randomly from 1 to 10 for dmax • Similarly we used the values 20,30,40 for the other three sets of demands maximum node degree 10
Conclusions • We reported two formulations of the spectrum allocation problem as two optimization problems: • first with the objective of maximizing the overall number of demands (Max-Demand) satisfied among the various base stations • the second with the objective of minimizing the overall interference in the network (Min-Interference) when all the demands of the base stations are satisfied • We showed that the optimization problems are NP-hard and designed efficient algorithms to solve them