Download
1 / 27
270 likes | 463 Vues
WHO European Centre for Environment and Health. WHO European Centre for Environment and Health. From Environment to Environment & Health indicators: Status & challenges. Michal Krzyzanowski Dafina Dalbokova Rokho Kim WHO ECEH Bonn Office http://www.euro.who.int/EHindicators.

E N D
WHO European Centre for Environment and Health WHO European Centre for Environment and Health From Environment to Environment & Health indicators: Status & challenges Michal Krzyzanowski Dafina Dalbokova Rokho Kim WHO ECEH Bonn Office http://www.euro.who.int/EHindicators
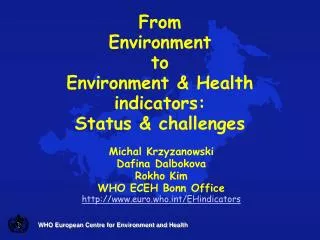
WHO European Centre for Environment and Health WHO European Centre for Environment and Health From ENVIRONMENT To Environment and HEALTH Indicators Links
WHO European Centre for Environment and Health WHO European Centre for Environment and Health • Challenges for Envirnment and Health Information System: • Simple message on a complex issue • Scientific uncertainty • Reporting overload • Diversity of sectors involved Links
WHO European Centre for Environment and Health WHO European Centre for Environment and Health Development of EG IS in Europe: WHO approach Declaration CEHAPE
WHO European Centre for Environment and Health WHO European Centre for Environment and Health Development of EG IS in Europe • Ministerial Declaration, § 16d • Set up decision making process for selection and approval of system elements • Establish international steering mechanism • Develop and update methodological guidelines; capacity building • Establish a network based on local / national / international organizations, building on existing infrastructure Declaration, § 16e: tasks of MS, WHO, EEA, EC, UNECE, UNEP…
WHO European Centre for Environment and Health WHO European Centre for Environment and Health Development of EG IS in Europe • International mechanism for selection and approval of system elements supported by the Member States EHIS WG: 10 Nov 2004 • A network active in the Region • Guidelines for a core set of indicators; • Development of EH indicators for EU countries (ECOEHIS) (2002-4) • Establishment of EH Info System in Europe: • ENHIS (2004/5) & ENHIS2 (2005/7) (CEHAPE!!) • Progress report: IG Conference 2007
WHO European Centre for Environment and Health WHO European Centre for Environment and Health Elements of EHIS Indicators Evidence Reporting
WHO European Centre for Environment and Health WHO European Centre for Environment and Health EH indicators recommended by ECOEHIS Recommended for EC Health Indicators core set Recommended for WHO implementation
WHO European Centre for Environment and Health WHO European Centre for Environment and Health Questions of policy-makers • What is (magnitude of) environment-related health problems? • When to act and how? • Health benefits of interventions? • Costs of interventions? • Are policy measures effective? • How to meet EU-obligations?
Women Men Yes (at least 1/week) Yes, but less often No, never 5% 10% 15% 20% x Noise from neighbors Road traffic noise Railway traffic noise Aircraft noise Industrial noise Ventilation noise Other noise sources Entertainment noise x x x x x x x Any of the above Annoyance by certain sources of noise in Sweden 1999 NMHS31. Have you during the last 3 months been annoyed by any of the following inside or in the vicinity of your home?
Europe Arlanda airport Sweden Märsta Stockholm County 65 dBA 60 dBA 55 dBA Stockholm County 50 dBA Arlanda Stockholm city
Prevalence of hypertension and aircraft noise level (FBN) 2.0 (0.8-5.3) 1.5 (0.9-2.5) 1.1 (0.7-1.9) OR* 1.0 <50 dBA 50-55 dBA 55-60 dBA >60 dBA *Adjusted for age, sex, smoking, and educational level
How big is the problem? Estimates for The Netherlands (RIVM)
How are NL doing in comparison ? • NL lowest % exp. to road traffic noise < 60 dB(A)? • Different methods differences in predicted noise levels up to 10-15 dB(A) • Harmonisation at EU level under way • Will be added to WHO-EHIS in future
WHO European Centre for Environment and Health WHO European Centre for Environment and Health Noise and health: Exposure indicators recommended for ECHI Noise_Ex1 Population exposed to various noise levels (Lden and Lnight) by different sources European directive 2002/49/EC for environmental noise: - maps of Lden (day-evening-night level) and Lnight (night level) - maps: the number of people located in areas exposed to nois - maps to be produced by June 30, 2007.
WHO European Centre for Environment and Health WHO European Centre for Environment and Health Air Pollution and Health: indicators Population exposure to PM10 Loss of LE preventible by 10% reduction in PM
Long term exposure to PM and risk of mortality in ACS cohort WHO European Centre for Environment and Health TFH 2003: “..apply the relative risk for all cause mortality… in the extended American Cancer Society (ACS) cohort study Pope et al. (2002).” Source: Pope et al, JAMA 2002
Anthropogenic contribution to PM2.5 Source: EMEP Eulerian model MSC-W 2000 2020 Rural concentrations, Annual mean [µg/m3]from known anthropogenic sources excluding sec. org. aerosols Emissions for 2020, no further climate measures, Average meteorology for 1999 and 2003,
Loss in life expectancy due to PM2.5 2000 2020 No cut-off assumed Loss in average life expectancy (days) Mean meteorology Source: IIASA
WHO European Centre for Environment and Health WHO European Centre for Environment and Health Exposure to air pollutants: indicators erecommended for ECHI AIR_EX1_PM10: population-weighted annual mean PM10 concentration AIR_EX1_PM2.5: population-weighted annual mean PM2.5 concentration AIR_EX1_O3: population-weighted annual mean ozone concentration AIR_EX1_NO2: population distribution of number of hours exceeding AQ limit values for NO2 in urban areas (EEA AP13) AIR_EX1_SO2: population distribution of number of days exceeding AQ limit values for SO2 in urban areas (EEA AP11)
Drinking water quality and health Drinking water quality Access to safe drinking water Water borne disease
WHO European Centre for Environment and Health WHO European Centre for Environment and Health Water and Sanitation: indicators erecommended for ECHI WatSan_Ex1 Safe drinking waters: Population connected to public water supply (EUROSTAT) WatSan_S2 Drinking water compliance Proportion of the drinking water samples analysed which fail to comply with the EU Directive on the quality of water intended for human consumptionrefers to regulated public water supplies
WHO European Centre for Environment and Health WHO European Centre for Environment and Health EEA-USEPA Workshop 27-28 Sept 2004 From Environment to Environment & Health indicators: Status & challenges • Conclusions • Focus on • Exposure – Effects -Actions • Start with existing data • Develop evidence-based messages