Wither the Phillips Curve?
Wither the Phillips Curve?. Activist demand management or Laissez – faire ?. Phillips Curve: Demand Side Inflation – Unemployment Tradeoff. A.W. Phillips (1958): found wages rose with falling unemployment in UK an inverse relation between wage inflation and unemployment .

Wither the Phillips Curve?
E N D
Presentation Transcript
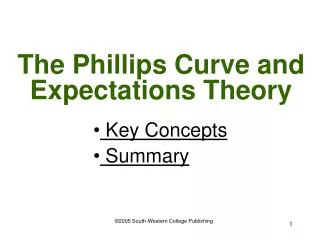
Wither the Phillips Curve? Activist demand management or Laissez – faire ?
Phillips Curve: Demand Side Inflation – Unemployment Tradeoff • A.W. Phillips (1958): found wages rose with falling unemployment in UK an inverse relation between wage inflation and unemployment. • Paul Samuelson and Robert Solow: an inverse relation between CPI inflation and unemployment in the US. • A downward-sloping “Phillips Curve” a policy trade-off between inflation and unemployment.
United States1955–2000 The relationship broke down when policymakers tried to apply it no evidence of a long-run Phillips Curve.
A Shifting Phillips Curve? How to reconcile the long-run data with the Phillips Curve trade-off: Treat the long-run as a series of short-run curves.
Starting at (1): 5% unemployment and 3% inflation. People believe inflation will continue at 3% Curve I. • Then Fed hypes inflation to 6% unemployment falls to 3% (Point 2 on Curve I). • Expectations adjust to 6% inflation Wage demands up Economy moves to point (3) Unemployment returns to 5%. • If expectations adjust instantly, e.g., anticipating Fed’s policy, economy moves directly from (1) to (3). Expectations and the Phillips Curve
Expectations Formation • Adaptive Expectations: expectations of the future based on history • The public acts on its expectations The present depends on the past
Expectations Formation • Rational Expectations: expectation based on all available relevant information. • The public understands how the economy works. • The public knows the structure and linkages between variables in the economy. • The public anticipates policy actions and their consequence • The public acts now on its expectations The present depends on the future
Time Inconsistency: Kydland & Prescott • A policy is time inconsistent if it seems a good idea at one time but becomes a bad idea later. • The way people anticipate and react to a policy may make a “good” policy “bad” • Time inconsistency hurts the Fed’s credibility. • It’s hard to believe the Fed will stick to a tight money policy once unemployment rises. • People anticipate monetary easing and inflation INFLATION
The Political Business Cycle:If a short-run Phillips Curve trade-off exists, an incumbent administration may hype demand and lower unemployment before an election … and then rein prices in with a recession after the election.
Real Business Cycles: Kydland and Prescott • Recessions and expansions may be triggered by real shocks to the economy. • Oil price shocks in the early 1970s higher production costs inward shift of AS severe recession of 1973-1975. • Technological or productivity shocks may also cause expansions or contractions. • Gone fish’n’ in the 1930s? “Real business cycles” are supply-side cycles, not demand-side cycles.
The Government Budget Constraint • Budget constraint highlights the relation between monetary and fiscal policy: • G - T = Bonds To Public+ Bonds to FedM = change in the money supply m = Money multiplier • M = m x Bonds to Fed • (G – T) is the fiscal surplus or deficit. Governments can offset the need to tax or to borrow from the public by “printing” money Inflation Tax.