actual
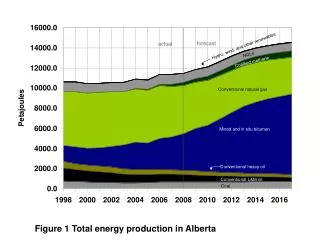
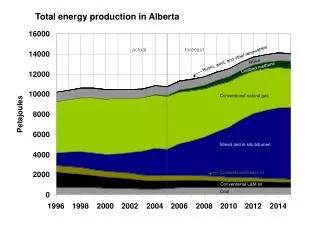
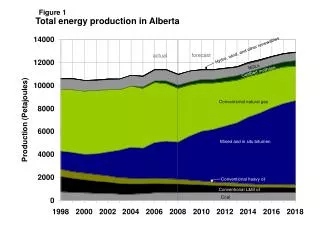
Hydro, wind, and other renewables. forecast. actual. Conventional heavy oil. Figure 1. Total energy production in Alberta. NGLs. Coalbed methane. Conventional natural gas. Mined and in situ bitumen. Conventional L&M oil. Coal. actual. forecast. Non upgraded bitumen. SCO.

actual
E N D
Presentation Transcript
Hydro, wind, and other renewables forecast actual Conventional heavy oil Figure 1 Total energy production in Alberta NGLs Coalbed methane Conventional natural gas Mined and in situ bitumen Conventional L&M oil Coal
actual forecast Non upgraded bitumen SCO Pentanes plus Heavy Light-medium Figure 3. Alberta supply of crude oil and equivalent
Figure 4 Total marketable gas production and demand actual forecast 23% 26% 33% 44% 58%
Bitumen* - includes producing and evaluation wells Gas** - includes CBM wells Other *** - includes unsuccessful, service, and suspended wells Figure 5. Drilling Activity in Alberta, 1948 – 2008
ERCB Prorationing Plan (restricted production) Major Oil Field Discoveries 1947 – Leduc 1948 – Redwater 1949 – Golden Spike 1952 – Bonnie Glen 1953 – Pembina 1957 – Swan Hills 1959 – Judy Creek 1959 – Swan Hills South 1965 - Rainbow Major Events Affecting Price 1973 – Oil Embargo 1979 – Iranian Revolution 1980 – Iran / Iraq War 1986 – OPEC Crumbles 1990 – Gulf War 1998 – Asian Econ. Crisis 2001 – 9 / 11 2003 – Iraq War Export Pipelines 1950 – Interprovincial Pipeline (Enbridge) 1953 – Trans Mountain Pipe Line 1938 - Petroleum and Natural Gas Conservation Board (ERCB) created to enforce production standards Source: Prices - CAPP Statistical Handbook Figure 6. Alberta Conventional Crude Oil Production and Price
Alberta Oil Sands Project Startup Great Canadian Oil Sands (Suncor) Startup Syncrude Startup Figure 7. Alberta mined bitumen and synthetic crude oil production and price
Hurricanes Katrina and Rita hit U.S. Gulf Coast Foothills Pipe Lines built for gas exports to California and the mid-western U.S. Northern Border pipeline expansion Alliance Pipeline on stream PGT expansion Regulated gas price tied to oil prices; Surplus built up Price deregulation Surplus gas drives down prices Arbitration awards price increase Gas prices as a by-product of oil production. Price less than replacement cost Figure 9 Historical natural gas production and price
Prices reached highs in the US$650-$840/tonne range in 2008 Figure 10 Sulphur closing inventories in Alberta and price
Late 1990’s – mine closures and reduced coal exports due to depressed coal prices 1970’s – increase in coal-fired electric generation 1952 – Beginning of change to diesel-electric trains 1950’s – Crude oil and natural gas replace coal as energy source of choice Late1960’s – Beginning of exports to Japan for steel industry 1898 – Expansion of railway network (coal and oil fired steam engines) and growth of population 1960 – Steam rail era ends Coal remained “King Coal” until huge reservoirs of crude oil and natural gas were discovered Figure 11 Historical coal production and price Australian-Japan contract price for thermal coal (Australian Bureau of Agricultural and Resource Economics - ABARE)
Figure 1.1 OPEC crude basket reference price 2008 Source: OPEC
forecast actual High Low Figure 1.3 Price of WTI at Chicago
forecast actual High Low Figure 1.4 Average price of oil at Alberta wellhead
Light-medium Heavy Bitumen Figure 1.5 2008 average monthly reference prices in Alberta
high forecast actual low Figure 1.7 Average price of natural gas at plant gate
actual forecast Figure 1.8 Alberta Wholesale Electricity Prices
Unemployment vs. GDP growth Unemployment rate Real GDP growth Prime vs. inflation Prime rate on Loans Inflation rate Exchange Rate Figure 1.10 Canadian economic indicators Source: Statistics Canada, Bank of Canada
actual forecast Oil sands Conventional oil and gas Coal and metal mining* Residential Public Other Figure 1.11 Alberta real investment Source: Statistics Canada, Canadian Association of Petroleum Producers *includes support activities to mining and oil and gas extraction
N/A 2007 - 2008 Value of Production in Alberta
Figure 2.2 Remaining established reserves under active development
ATHABASCA 114.7 PEACE RIVER 6.4 36.9 COLD LAKE 49.4 In Situ Mined Bitumen Figure 2.8. Production of Bitumen in Alberta, 2008 103 m3/d
Figure 2.10. Total in situ bitumen production and producing bitumen wells
Peace River OSA Athabasca OSA Synthetic Crude Oil Cold Lake OSA Figure 2.11. In situ bitumen production by oil sands area (OSA)
Experimental Production SAGD Production CSS Production Synthetic Crude Oil Primary Production Figure 2.12. In situ bitumen production by recovery method
actual forecast Surface mining In situ Figure 2.13. Alberta crude bitumen production
actual forecast Synthetic crude oil Synthetic Crude Oil Figure 2.14. Alberta synthetic crude oil production
Synthetic Crude Oil Oil Sands Plants – Coke Inventory Figure 2.17. Alberta oil sands upgrading coke inventory
actual forecast Nonupgraded bitumen removals from Alberta SCO removals from Alberta Synthetic Crude Oil Alberta demand (mainly SCO) Figure 2.18. Alberta demand and disposition of crude bitumen and SCO
Heavy Light-medium Figure 3.1 Remaining established reserves of crude oil
Figure 3.2 Annual changes in conventional crude oil reserves
(103 m3) Total number of pools Initial reserves (103m3) Remaining reserves (103m3) Figure 3.4 Distribution of oil reserves by size
Figure 3.7 Geological distribution of reserves of conventional crude oil
2008 Initial established reserves 2773 106 m3 2008 Remaining established reserves 233 106 m3 187 156 18 10 1184 490 48 467 Fig. 3.8. Regional distribution of Alberta oil reserves 2008 (106 m3) 71 43 5 21 268 38
Figure 3.9 Alberta’s remaining established oil reserves versus cumulative production