Download
1 / 26
260 likes | 385 Vues
Safe Routes to School. School-based projects from a Transportation Act program. SAFETEA-LU. Federal master transportation act Funded by gas taxes Included roadway construction and maintenance funding Safety project funds “Enhancement” funding for trails and sidewalks

E N D
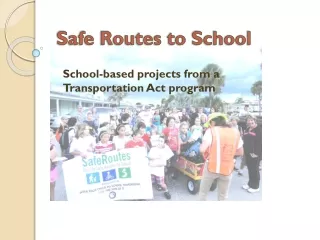
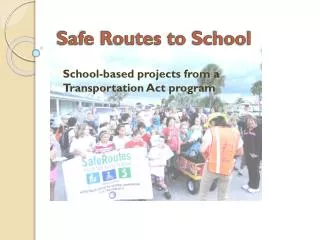
Safe Routes to School School-based projects from a Transportation Act program
SAFETEA-LU • Federal master transportation act • Funded by gas taxes • Included roadway construction and maintenance funding • Safety project funds • “Enhancement” funding for trails and sidewalks • First time: Safe Routes to School program
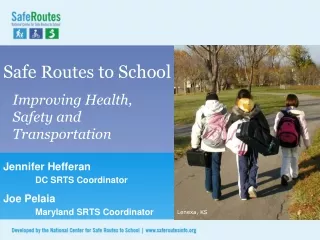
SRTS stated Objective (Purpose) • To encourage children, K-12, including the disabled, to walk and ride bikes to school • Obesity cited as a major concern
Why do we need to change? • Florida Child Obesity (age 2-19): 18.3% • Adult: 26% and rising • Physically Active Florida Children (Age 6-17): 34.1% • Increasing health care costs • shortened lifespan • Source: Robert Wood Johnson Foundation: 2011
SAFETEA-LU—Safe Routes • Funding began in 2005 • Funding flexibility 70-90% infrastructure Sidewalks, trails, traffic calming, bike storage 10-30% non-infrastructure Education, outreach, promotion
How much in Florida ? • Between 2005 and 2012 over $55 million Long term infrastructure benefits • Cost of 1 mile 5’ sidewalk – generic $120,355 expected lifetime, 50 years • Cost of 1 mile 12’ shared use path $237,185 expected lifetime, 30 years
Focus on schools, new to DOT • FDOT studies include preliminary design and engineering (PD&E) phase • PD&E manual barely mentions schools • Pedestrian and bike accommodation, part of the PD&E process *** • By statute, hazardous walking condition requires responsible agency to address the condition within a reasonable time
Program development • Infrastructure projects, local applications—filtered for constructability • Non-infrastructure—more difficult to find and carry out • All projects aimed to encourage change
Competing ideasabout children walking or biking • Culture of cars • Dependence on Others • World is essentially unsafe • Generational changes • Culture of flexibility in mobility • Independence • World is complex • Past was different but instructive
One medium-sized county • 49 Schools for 41,000 students • 295 School buses transport 23,000 students daily • 10,000 bus stops • 29,000 miles per day/5.39 million miles per year • Transportation Costs: $19.5 Million/year
Saving money when funds are tightEnding courtesy busing, using depot systems
A little about infrastructure (Needs) • Many needs for pedestrian facilities • Challenges • Right of way • Drainage impacts (environmental) • Local opinions
Eustis Eustis Heights Some sample projects
Walking to School kits Better bike racks Non-infrastructure and bike parking
Why Kids Don’t Walk to School Factors affecting parents’ decision to let children walk to school: Distance (52%) Safety crossings (42%) Weather/climate (41%) Presence of sidewalks/pathways(38%) Traffic volume(36%) Speed along route(35%)
Safety • Predictable- teaching children to act in ways that can be recognized • Visible- encouraging bright clothing, reflectivity or light; walking in groups
Security -- Surveys uncover attitudes • Concerns about • Bullying, verbal and physical threat, 32% of 12-18 year olds report being bullied • Gangs—23% report gangs in schools • Personal violent crime—though reported, significant decrease over past 10 years • Abduction—2% are non-family, most are missing for other reasons (lost, injured, stranded) Diverse counter measures to avoid these situations
Overview of countermeasures • Teach children to speak up • Help children to be street smart • Involve families in designing safe strategies • Encourage groups • Practice with adult supervision Long term benefit, independent ‘free range’ young people
Walking school buses • Success depends on community characteristics, one size doesn’t fit all • Simple beginnings sometimes are best • Organized volunteers and coordinators • Small incentives for participating
Bike trains • Suitable for older students http://guide.saferoutesinfo.org/walking_school_bus/index.cfm
DOT resources • http://www.hhp.ufl.edu/safety/ • Contacts for bike and ped teacher training • http://www.pedbikesrc.ce.ufl.edu/ • Many safety and best practice handouts: tip sheets, pamphlets, curriculum guides, small items for promotion
Coming soon • Workshops around Florida about walking school bus techniques http://www.pednet.org/programs/ Contact FDOT SRTS coordinator for details http://www.dot.state.fl.us/safety/SRTS_files/SRTS.shtm
Big Picture – long range coordination among agencies Source: Ruth Steiner, Ph.D, UF, 2006)
What We need from schools Information, collaborative planning • Annual information about hazardous walking conditions • School representation during PD&E studies for new projects • Participation in transportation planning process at MPO • Coordination during school site selection and design (early and often)
Questions ? Joan Carter, FDOT, District Five Bicycle and Pedestrian Coordinator DeLand, 32720 (386) 943-5335