Introduction to BioConductor
Introduction to BioConductor. Friday 23th nov 2007 Ståle Nygård (staaln@math.uio.no) Course in Statistical methods and bioinformatics for the analysis of microarray data. What is BioConductor?.


Introduction to BioConductor
E N D
Presentation Transcript
Introduction to BioConductor Friday 23th nov 2007 Ståle Nygård (staaln@math.uio.no) Course in Statistical methods and bioinformatics for the analysis of microarray data
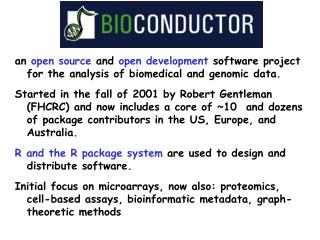
What is BioConductor? • An open source and open development software project for the analysis and comprehension of genomic data. • Started in 2001. The core team is based primarily at the Fred Hutchinson Cancer Research Center. • Is primarily based on the R programming language. There are two releases of Bioconductor every year. In addition there are a large number of meta-data packages available, mainly, but not solely oriented towards different types of microarrays.
Goals of the Bioconductor Project • Provide access to a wide range of powerful statistical and graphical methods for the analysis of genomic data. • Facilitate the integration of biological metadata in the analysis of experimental data: e.g. literature data from PubMed, annotation data from LocusLink. • Allow the rapid development of extensible, scalable, and interoperable software. • Promote high-quality documentaion and reproducible research • Provide training in computational and statistical methods for the analysis of genomic data.
Main features of the Bioconductor Project • Use of R • Documentation and reproducible research • Statistical and graphical methods • Annotation • Bioconductor short courses • Open source • Open development
Use of R • R and the R package system are the main vehicles for designing and releasing software.
Documentation and reproducible research • Each package contains at least one vignette, which is a document that provides a textual, task-oriented description of the package's functionality and that can be used interactively. • In the future: looking towards vignettes not specifically tied to a package, but rather demonstrating more complex concepts.
Bioconductor FAQ: http://www.bioconductor.org/docs/faq/index.html#Open%20source • Book:
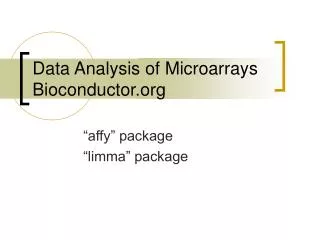
Statistical and graphical methods • Bioconductor analysis packages • Preprosessing Affymetrix and cDNA array data • Identifying differentially expressed genes • Graph theoretical analyses • Plotting genomic data • In addition, R itself provides implementations for a broad range of state-of-the-art statistical and graphical techniques including • Linear and non-linear modeling • Cluster analysis • Prediction • Resampling • Survival analysis • Time series analysis (Screenshots: http://www.bioconductor.org/whatisit/screenshots/)
Annotation • Bioconductor project provides software for associating genomic data in real time to biological metadata from web databases such as GenBank, Locus Link, and Pubmed(annotate package). • Provides functions for incorporating the results in HTML reports with links to annotation www resources • Provides software tools for assembling and processing genomic annotation from databases such as GenBank, the Gene Ontology Consortium, LocusLink, UniGene, the UCSC Human Genome Project (AnnBuilder package). • Data packages are distributed to provide mappings between different probe identifiers (e.g. Affy IDs, LocusLink, PubMed). Customized annotation libraries can also be assembled.
Bioconductor short courses • The Bioconductor project has developed a program of short courses on software and statistical methods for the analysis of genomic data. (course materials etc at: http://www.bioconductor.org/services/workshops)
Open source • There are many different reasons why open-source software is beneficial to the analysis of microarray data and to computational biology in general, because it • facilitates full access to algorithms and their impementation • enables to fix bugs and extend and improve the supplied software • encourages good scientific computing and statistical practice by providing appropriate tools and instruction • provides a workbench of tools that allow researchers to explore and expand the methods used to analyze biological data • ensures that the international scientific community is the owner of the software tools needed to carry out research • leads and encourages commercial support and development of those tools that are successful • promotes reproducible research by providing open and accessible tools with which to carry out that research
Open development • Users are encouraged to become developers, either by contributing bioconductor compliant packages or documentation.
Installation of bioconductor • Install R • Install bioconductor packages: http://www.bioconductor.org/docs/install-howto.html Installation tailored for this course: http://sfi.nr.no/sfi/index.php/Click_here To check if your packages really is installed type library().