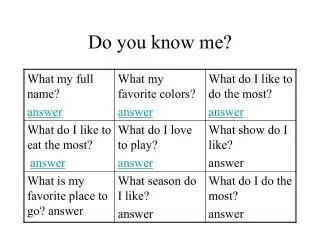
Do you know me?
My name is Jin. My name is Jean. My name is Gene. My name is Jeanne. Do you know me?. The New Science of Unconscious Bias: Workforce and Patient Care Implications . Webinar Agenda. The New “Science of Bias”

Do you know me?
E N D
Presentation Transcript
My name is Jin. My name is Jean. My name is Gene. My name is Jeanne. Do you know me? The New Science of Unconscious Bias: Workforce and Patient Care Implications
Webinar Agenda • The New “Science of Bias” • The Implicit Association Test • Workforce Implications • Patient Care Implications • Implications for HealthCare Generally
New Scientific Developments Ask: How Volitional is Human Behavior? • Biology and Neuroscience - Advances in brain science are calling into question the volition behind many criminal acts. These developments challenge the mens rea (mental state) requirement in criminal law. • Psychology/Social Cognition Theory – Advances in cognitive psychology suggest that implicit or unconscious bias is far more widespread than we have previously understood. Much of discriminatory behavior may not be “intentional”. These developments challenge the intentionality requirement in employment law.
Biology and Neuroscience Findings • The Case of Richard Speck • The Case of “Alex” 3. Frontotemporal Dementia Cases See: The Brain on Trial, Atlantic Monthly, July/August 2011
Biology and Neuroscience Findings • When your biology changes, so can your decision-making and your desires. • The drives you take for granted (“I’m heterosexual,” “I’m attracted to children/adults,” “I’m aggressive/not aggressive,” and so on) depend on the intricate details of your neural machinery and genetic make-up. • Although acting on such drives is popularly thought to be a free choice, biological and neuroscientific evidence demonstrates the limits of that assumption. • Who we are or consider ourselves to be may be as much (or more) about biology than free will.
Psychology and Social Cognition Theory • Freudian Psychology - the human mind defends itself against the discomfort of guilt by denying or refusing to recognize those ideas, wishes and beliefs that conflict with what the individual has learned is good or right. • Social Cognition Theory – In order to make sense of the world, we organize people into groups or categories People with whom we are more familiar are generally seen as smarter, funnier and more personable than others. Positive attitudes or biases are associated with these individuals while negative attitudes or biases are associated with individuals or groups with whom we are least familiar.
Perceptions of “Groupness” Distort Perception and Behavior • Experiments by Tajfel and others showed that, as soon as people are divided into groups – even on trivial or random bases – strong biases resulted. • Subjects perceived members of their group as more similar to them and members of other groups as more different. • Subjects saw in-group members highly differentiated individuals and out-group members as largely homogenous. • Subjects were better able to recall undesirable behavior of outgroup members than similar behavior of ingroup members. • Ingroup members failures were attributed to situational factors while outgroup failures were attributed to innate characteristics. • Subjects permitted to allocate monetary rewards maximized rewards to their own group and minimized rewards to outgroups.
Awareness: New Research re: Bias • In the past, bias was regarded as aberrant, conscious and intentional. • Today, we understand that bias is normative, unconscious and largely unintentional. • Social Cognition Theory establishes that mental categories and personal experiences become “hard-wired” into cognitive functioning. 4. As a result, human biases can be seen as evolutionarily adaptive behaviors.
Human Biases Are Evolutionarily Adaptive But Socially Destructive • Evolutionarily adaptive: We go out in the world every day and make decisions about what is safe or not. Scientists estimate that we are exposed to as many as 11 million pieces of information at any one time, but our brains can only functionally deal with about 40. Our brains act efficiently to determine whether or not something or someone is safe before we can even begin to consciously make a determination. 2. Socially destructive: Unconscious biases towards those least like ourselves create the preconditions for making moral judgments about the behaviors of others and actively discriminating against them.
Brain Scans Show Activation of the Amygdala Brain scans using magnetic resonance imaging techniques has found that white subjects respond with a greater activation of the amygdala – a region that processes alarm – when shown images of black faces than when shown images of white faces. (One of the amygdala’s critical functions is fear-conditioning…) Later studies have shown similar results when black subjects look at white faces. Source: Race and the Brain, Time, October 20, 2008, at p. 59.
What Activates Our Biases? Our biases are most likely to be activated by four key conditions. They are: • stress • time constraints • multi-tasking • need for closure
Key IAT Findings - Age • Age: Around ninety percent of Americans mentally associate negative concepts with the social group "elderly"; only about ten percent show the opposite effect associating elderly with positive concepts. Older people do not, show an automatic preference for their own group. Remarkably, the preference for “young” is just as strong in those in the over-60 age group as it is among 20-year-olds.
Key IAT Findings - Gender • Gender: Seventy-five percent of men and women do not associate female with career as easily as they associate female with family. (Women show an implicit attitudinal preference for females over males, but they nonetheless show an implicit stereotype linking females closer to family than career.)
Key IAT Findings - Race • Race: White participants consistently show a preference for White over Black on the IAT – a substantial majority of White IAT respondents (75% to 80%) show an automatic preference for White over Black. Data collected from this website consistently reveal approximately even numbers of Black respondents showing a pro-White bias as show a pro-Black bias. • Other key race findings: younger people are just as likely to display an implicit race bias as older adults, women are as likely to display an implicit race bias as men and educational attainment appears to make no difference with respect to implicit race bias.
Summary: Key IAT Trends • Implicit biases are pervasive. • People are often unaware of their implicit biases. • Implicit biases predict behavior. • People differ in levels of implicit bias. • Educational attainment makes no difference with respect to implicit biases.
Biases Impact Decisionmaking Unconscious bias can infect management decisions throughout the employment life cycle: a. Interviewing. Recruitment, hiring & retention. b. Expectations of and interactions with employees. (“Micro-inequities”) c. Employee evaluations. (“Set Up to Fail Syndrome” – Harvard Business Review) d. Decisions about promotions, training and other job benefits. e. Termination and discharge decisions.
The “Big Five” Orchestras • Chicago and Boston • None of the Big Five employed more than 12% women until the 1980’s • Blind auditions • Improved the chances that a woman would ultimately be hired • Female musicians in the Big Five increased five-fold from 1970 to 2000 Orchestrating Impartiality: the Impact of “Blind” Auditions on Female Musicians, 94 Am. Econ. Rev. 715 (2000).
Are Emily & Greg More Employable than Lakisha & Jamal? • Study of actual racial hiring bias in Chicago and Boston • Resumes sent to actual want ads • 4 resumes per position – 2 “high” quality and 2 “low” quality • African American sounding names assigned to one high quality and one low quality • Primary measurement was the “callback” rate • Results: people with "white-sounding" names are 50 percent more likely to get a response to their resume than are those with "black-sounding" names. Marianne Bertrand and SendhilMullainathan, Are Emily and Greg More Employable Than Lakisha and Jamal? Field Experiment on Labor Market Discrimination, 94 Am. Econ. Rev. 991 (2004).
Diversity and Productivity • Effective diversity programs are associated with higher productivity (+18%). (National Urban League, 2004) • Gallup found that 24.7 million U.S. workers, or 19%, are actively disengaged. Another 56% of workers were not engaged, while only 25% of workers were actively engaged. Result: 75% of workers are not fully engaged. • “Actively disengaged" employees -- those fundamentally disconnected from their jobs -- cost the U.S. economy between $292 billion and $355 billion a year. (Gallup) • What causes workers to disengage at work? One notable cause is DRI’s – Diversity Related Incident’s of Disrespect.
Workplace Incivility – DRI’s • Studies have found that over 71 percent of the workforce has experienced some form of workplace incivility in the last five years. Incivility is evidenced by disrespectful behavior. Source: Don Zander, Brookings Institution, 2002 • Of the reported incidents of workplace-related DRI’s: 32% were related to gender; 28% were related to race; 20% were related to age; 14% were related to sexual orientation and 6% were related to religion.
Workplace Incivility – DRI’s Fiscal Impact of Workplace Incivility: Of those who experienced work-place related DRI’s: • 28% lost work time avoiding the instigator of the incivility; • 53% lost time worrying about the incident/future interactions; • 37% believe their commitment at work declined; • 22% have decreased their effort at work; • 10% decreased the amount of time that they spent at work; • 12% actually changed jobs to avoid the instigator. Source: The Sparticus Group: 2003.
Race, Ethnicity and Perceptions of Workplace Relationships in Healthcare Management White Asian Black Hispanic Race relations within my company Women 79% 60% 41% 55% are good. Men 90% 70% 53% 73% Managers of Color usually have to Women 6% 29% 75% 47% be more qualified to get ahead here. Men 3% 33% 66% 35% White managers share vital growth Women 57% 29% 10% 18% and career-related information with Men 55% 37% 12% 30% managers of color. The evaluation of both whites and Women 69% 51% 18% 33% employees of color are equally Men 75% 50% 22% 43% thorough and carefully evaluated . Has a strong feeling of belonging Women 82% 70% 58% 71% to the organization. Men 85% 72% 72% 79% Source: A Race/Ethnic Comparison of Career Attainment in Healthcare Management: American College of Healthcare Executives; Institute for Diversity in Healthcare Management, 2002
The Effect of Race and Sex on Physicians'Recommendations for Cardiac Catheterization • 720 physicians viewed recorded interviews • Reviewed data about a hypothetical patient • The physicians then made recommendations about that patient's care Source: Schulman et.al. NEJM 1999;340:618.
New Study Finds Unconscious Bias in M.D. Decision-making • Emergency room doctors in the study were told two men, one white and one African-American, were each 50 years old and complained of chest pain. The patients were not actually real people, but rather computer-generated images seen by the doctors only on a monitor. • After the doctors in the study evaluated the two simulated patients, they were then given an implicit association test examining unconscious racial biases. • The result was most of the doctors were more likely to prescribe a potentially life-saving, clot-busting treatment for the white patients than for the African-American patient. • The study, by the Disparities Solutions Center, affiliated with Harvard University and Masschusetts General Hospital, is the first to deal with unconscious racial bias and how it can lead to inferior care for African-American patients. It was published in the online edition of the Journal of General Internal Medicine in June, 2007.
Research has found that Hispanic, Asian, andAfrican Americans, compared to whites, report lower qualityin their overall interaction with their physicians, less timespent with their physicians, poorer patient-physician communication,diminished trust in their physicians, and less respect fromtheir physicians. 2. A 2007 Harvard School of Public Health/Robert Wood JohnsonFoundation survey of 4,334 randomly selected U.S. adults comparedperceptions of the quality of physician care among fourteenracial and ethnic groups with those of whites. On each measureexamined, at least five and as many as eleven subgroups perceivedtheir care to be significantly worse than care for whites. Inmany instances, subgroups were at least fifteen percentage pointsmore negative than whites. Many of the differences remained after socioeconomic characteristicsand language skills were controlled for. Health Affairs, May ‘08. U.S. Patient Satisfaction Data – Race
Picker – Inpatient Satisfaction with Doctors By Race, CLIENT 2003-2005 Question/StatementWhiteOf ColorSignif? Didn’t always have confidence/trust 14.5% 26.1% Yes in my doctors. Doctors talked as if I wasn’t there. 6.3% 23.2% Yes Courtesy of doctors “fair” or “poor” 2.5% 5.5% Yes Doctors/nurses gave conflicting info. 21.5% 26.5% Yes * Scores over 20% are considered “problems” by Picker.
Picker – Inpatient Satisfaction with Nurses By Race, CLIENT 2003-2005 Question/StatementWhiteOf ColorSignif? Didn’t always have confidence/trust 24.8% 34.7% Yes in my nurses. Nurses talked as if I wasn’t there. 6.5% 22.9% Yes Courtesy of nurses “fair” or “poor” 3.5% 5.6% Yes Nurses answers to questions . 25.8% 29.6% Yes weren’t always understood. * Scores over 20% are considered “problems” by Picker.
Picker – Treated with Courtesy, By Race, CLIENT 2003-2005 Question/StatementWhiteOf ColorSignif? Courtesy of admissions staff rated 2.0% 5.9% Yes fair or poor. Courtesy of people who took blood 2.8% 8.8% Yes samples rated fair or poor Courtesy of people who brought food 5.0% 8.8% Yes rated fair or poor. Courtesy of people bringing to and from 1.2% 6.2% Yes room rated fair or poor. Courtesy of people taking x-rays rated 1.4% 7.6% Yes fair or poor. Courtesy of people who cleaned room 3.3% 8.6% Yes rated fair or poor
Picker – Other Key Indicators of Care By Race, CLIENT 2003-2005 Question/StatementWhiteOf ColorSignif? Not always treated with respect and 13.1% 21.6% Yes dignity. Didn’t always get help in time going 20.4% 30.8% Yes to the bathroom. After using call button, had to wait > 15 2.1% 4.3% Yes minutes for help. Staff definitely did not do everything 19.7% 26.3% Yes they could to control pain. Didn’t have enough say about pain 26.1% 38.4% Yes control during delivery. Probably would or would not 23.9% 28.8% Yes recommend to family/friends.
When Health Care Isn’t Caring • Lambda Legal surveyed 4,916 GLBT people and people living with HIV nationwide in the spring of 2009. Results showed that these populations were frequently: • Denied care; • Treated in a discriminatory manner while obtaining care; • Subjected to harsh or abusive language by health professionals; • Treated by health professionals who refused to touch them or used excessive precautions when doing so; • Blamed for their conditions by health professionals
When Health Care Isn’t Caring Source: When Health Care Isn’t Caring: Lambda Legal’s Survey on Discrimination Against LGBT People and People Living With HIV, (New York: Lambda Legal, 2010). Available at: www.lambdalegal.org/health-care-report
When Health Care Isn’t Caring Source: When Health Care Isn’t Caring: Lambda Legal’s Survey on Discrimination Against LGBT People and People Living With HIV, (New York: Lambda Legal, 2010). Available at: www.lambdalegal.org/health-care-report
Action Steps - Workforce • Conduct a Diversity Workforce Assessment A. Stratify data by key demographic categories B. Stratify data by location 2. Train Managers on How to Manage a Diverse Workforce A. Managing a Diverse Workforce B. Managing a Culturally Diverse Workforce • Teach Managers Diversity Skills
The Culturally Competent Manager: Skills • Culturally inquisitive, manages own biases • Capable of perspective shifting • Hires, retains, manages and mentors diverse workforce • Trust building with diverse employees • Cross-cultural communication • Teambuilding • Cross-cultural conflict resolution • Issue-spots diversity-related employment matters that could create liability • Masters the art of complaint handling
Action Steps – Patient Care • Collect Patient Demograpic Data 2. Audit Hospital Performance Against the CLAS Standards and New Joint Commission Standards • Conduct a Language Access Audit • Conduct a Provider Cultural Competence Assessment • Tie Data Collection Results to Quality Assurance Efforts. A. < 20% collect race/ethnicity data & tie it to outcomes B. 80% of U.S. hospitals see LEP regularly but less than 30% have efforts underway to improve language access services. 6. Provide Training to Providers on New Cultural Competence Skills
Seven Skills for the Global M.D. • How to conduct a culturally competent patient examination and medical history using the LEARN Model (Listen, Explain, Acknowledge, Recommend, Negotiate) • How lack of knowledge of epidemiological and pathophysiological differences may lead to unintended iatrogenic consequences. • How to work with patients using qualified medical interpreters. • Understanding the Law of Language Access (implications for informed consent and other legal issues) • Managing cross-cultural conflict and negotiating treatment plans . • Cross-Cultural Medical Ethics (examples: cultural differences around death and dying, blood beliefs, surgery, organ transplants, mental health etc.) • Ethnopharmacology and its implications for current clinical practice
For Additional Information, ContactDavid B. Hunt, J.D., PresidentCritical Measures, LLC(612) 746-1375dbhunt@criticalmeasures.net www.criticalmeasures.net