Download
1 / 40
400 likes | 719 Vues
Flow Time Analysis (Ch 4 of MBPF). And a cautionary tale. Flow Time Analysis. Inputs. Processing System. Outputs. T. Flow time = processing time + wait time (total time in the box). Theoretical Flow Time is the time to process a typical flow unit assuming NO waiting.

E N D
Flow Time Analysis (Ch 4 of MBPF) And a cautionary tale
Flow Time Analysis Inputs Processing System Outputs T Flow time = processing time + wait time (total time in the box) Theoretical Flow Time is the time to process a typical flow unit assuming NO waiting.
Flow Time Analysis • Total amount of time for a flow unit to flow from the entry to exit point of a process • Includes delays and work • Includes value added and NVA activities • Shortening flow time often “good” • Decrease response time (Dell computer) • Reduce inventory (less $ tied up in WIP) • New product/service development (auto) • Robust to short product life cycles • Fast feedback on quality problems • An indicator of overall process excellence
Process Flow Charting • Flow charts are graphical representations of processes • May capture inputs, outputs, activity network, resources used, locations visited, decisions or business logic, buffers and delays • Many tools available, we’ll use iGrafx Process as it is bundled with our MBPF text • Very good flow charting engine • Numerous templates for various kinds of common business diagrams • Also has a relatively easy to use and pretty powerful process simulation capability. We will use this.
To learn iGrafx Process, start by doing the Tutorial on “Creating Process or Swimlane Diagram” which you can find in the iGrafx Tutorials menu or iGrafx Help menu. This tutorial does NOT cover the simulation features of iGrafx but instead just gets you started building process diagrams. We’ll learn the simulation features as we move along in the semester.
Process Flow ChartsUsing PowerPoint or iGrafx Process Wait/ Buffer Activities/Subprocesses Start/End Events Decision Use AutoShape - Flowchart Use connection tool Activity Precedence
Old Medical Transcription Process • Diagnosis • Plan of care Physician dictates into tape recorder Start Exam Print Report Physician reviews report Transcribe into word processor Wait Wait yes Changes? Send report to medical records dept. End Process no
Process Flow Charting in Practice • Multi-disciplinary team • Have each team member do own flow chart • Why? • Group facilitator or group tries to reach consensus on process flow chart • Yellow sticky notes • Examine and revise by group • Examine parts • Don’t get buried in details • Genuine disagreement may occur • More flow charting resources • A Fresh Look at Flow Charting • http://www.q-skills.com/flowchrt.html • Flow Charting Help Page • http://home.att.net/~dexter.a.hansen/flowchart/flowchart.htm#Definition • Flow Chart Overview • http://deming.eng.clemson.edu/pub/tutorials/qctools/flowm.htm
Other Process Description Tools • Swim lanes or Service System Maps • Enhanced flow charting technique using bands to delineate department participation in process steps • Variants can use color or other features to represent more process information • iGrafx Processes are of this type • Process Activity Charts • See next slide and Excel file ProcessActivityChart.xls
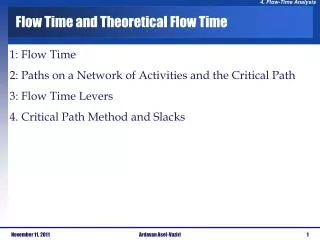
Finding Theoretical Flow Time Sequential & Parallel Path 1: 1-3-5-7-8 (T1=80) Path 2: 1-2-4-6-7-8 (T2=90) T* is the length of longest path through the process The path associated with T* is called the Critical Path Activities on the Critical Path are called Critical Activities
Finding the Critical Path • If process is “simple”, we can • enumerate all the possible paths • Calculate their length • Find the longest path • If process is complex, may be too many paths to enumerate • Various algorithms exist for this • See Appendix of Chapter 4 in MBPF for Critical Path Method • Same method as used to find critical path in project management networks (e.g. MS Project)
Observations about Critical Path • Delaying an activity on CP will increase T* • Activities NOT on CP can be delayed to some degree without increasing T* • Speeding up activities on the CP will decrease T* • Speeding up activities NOT on the CP will NOT decrease T* • The CP can change as we change the activity times • We are still assuming the activity times are known deterministic quantities (no randomness)
Flow Time MeasurementThe Direct Method • Observe the process over some specified, extended period of time • Take random (or exhaustive) sample of flow units • Calculate flow time, T, for each by (tend – tstart) • Calculate average T over sampled flow units • Example: CalcFlowTime.xls
Flow Time MeasurementThe Indirect Method • Observe the process over some specified, extended period of time, t • Measure number of flow units, N, processed over the time period, t • Compute throughput, R=N/t • At random points in time, count the number of flow units in process. Compute the average of these counts (we’ll call it I) • Use Little’s Law to estimate T=I/R Let’s revisit CalcFlowTime.xls
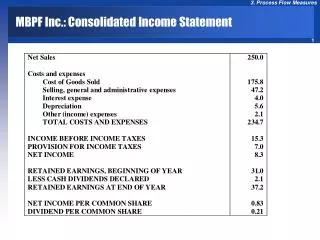
Actual Flow Time vs. Theoretical Flow Time • Most processes have numerous delays • Estimate avg. delay times and treat as activities • Value added vs Non-value added activities • See Example 4.7 (p86) for X-ray process example • Problem 4.1 in MBPF T* = 55 TA = 70 Flow Time Efficiency = T*/TA = 55/70 = .786 Many real processes have very low Flow Time Efficiency
Levers for Managing Theoretical Flow Time • We are ignoring waiting/delays for now • Three broad methods for reducing T* • Eliminate: Reduce work content of a critical activity • Work in parallel: Move some work content off of the critical path • Select: Modify the product mix
Eliminate • Roots in scientific management and industrial engineering • Some combination of • Eliminate NVAs (“work smarter”) • Classic BPR example: Ford Accounts Payable • Reduce # repetitions of task (“less rework”) • Build quality into process (poke-yoke) • Statistical process control • Design for manufacturability • Workforce training • Increase speed (“work faster”) • Incentives • Better technology • More resources
Work in Parallel • Move work off CP to non-critical activity • Move work off CP to “outer loop” • Pre or post processing • Examples: pre-authorization, pre-admission testing, pre-registration • Usually requires process redesign • Often some enabling communications technology required to facilitate parallel work • Example: concurrent engineering facilitated by CAD and high bandwidth networks allowing transfer/sharing of large electronic files
Reengineering/Redesign The fundamental rethinking and radical redesign of business processes to achieve dramatic improvements in critical contemporary measures of performance such as cost, quality, service and speed. Reengineering the Corporation, Hammer and Champy, Harper Business (1993)
Radical rethinking/redesign of processes Clean sheet of paper Benchmark best practices Commitment from top leadership Question unconscious assumptions Value added vs. Non-value added activities Why redesign business processes? How to go about redesign? What is role of information technology? Relationship to continuous improvement, total quality management? Isn’t reengineering just another word for layoffs and downsizing? Process Reengineering A 1st Look
BPR Life Cycle • Process Analysis • Idea Generation • Establish a goal and Define Scope • Generate Strategies • Evaluate and Select • Design and Implement • Sustain
Why Redesign? • Current process “broken” (or may not exist) • No one seeing big picture • No one questioning business assumptions • Incremental improvement efforts insufficient • Go beyond perspective of “how we do things” • Processes critical to business success
Classic Reengineering Principles • Organize around outcomes, not tasks • Have output users “do” the process • Treat geographically dispersed resources as though they were local • Link parallel activities instead of integrating results • Put decision point where work performed and build control into the process • Capture information once, and at the source “Reengineering Work: Don’t Automate, Obliterate”, Hammer and Champy, Harvard Business Review (July-Aug 1990)
IHI: Redesign the System (p42-53) • Do tasks in parallel – info gather during waits • Use multiple processes – ED fast track • Minimize handoffs – reduce unit transfers • Synchronize – surgery starts at incision • Use pull systems – pull asthma from ED to clinic • Move steps closer together – registering ED patients in treatment area • Use automation - PACS • Consider people to be the same system – self-scheduling of surgery by surgeon office • Use multiple processing units – increase staffing • Extend the time of specialists – nurse aide • Convert internal steps to external – outsource transcription
The 5-step BPR Framework • Develop the Business Vision and Process Objectives • Identify the Processes to be Redesigned • Understand and Measure the Existing Process • Identify IT Levers • Design and Build a Prototype of the New Process “The New Industrial Engineering: Information Technology and Business Process Redesign”, Davenport and Short, Sloan Management Review (Summer 1990)
The Fad That Forgot People Reengineering didn’t start out as a code word for mindless bloodshed. It wasn’t supposed to be the last gasp of Industrial Age management. I know because I was there from the beginning. I was one of the ‘creators’. The Fad That Forgot People, Davenport, T.H., Fast Company, November 1995.
The Fad That Forgot People, Davenport, T.H., Fast Company, November 1995. BPR – What Happened? • Started as real people with real problems • Ford Motor Co., Mutual Benefit Life, HP • Synthesis of 3 concepts • Technology • Business processes • Clean-sheet-of-paper approach • Companies did stuff, academics and consultants started to “model make” • Davenport, Hammer and Champy wrote “bible” articles and books
The Fad That Forgot People, Davenport, T.H., Fast Company, November 1995. The Feeding Frenzy • Top managers + big-time consultants+IT vendors = $$$ • Early successes were trumpeted • Projects labeled “BPR” • People always looking for “magic solution” • Consultants started packaging BPR services • Big $$$ contracts • Executives needed to justify $$$ spent • Layoffs quickest way to realize savings • IT firms selling hardware, software AND reengineering consulting
Reality Bites The Fad That Forgot People, Davenport, T.H., Fast Company, November 1995. • Massive layoffs labeled “reengineering” • Alienation of good employees • Treated as interchangeable cogs in corp. machine • 25 yr old MBA’s making $80K as BPR “experts” • Major project failures • Consultants start repositioning for next wave • And sell BPR to “rest of the world”
The Good Stuff The Fad That Forgot People, Davenport, T.H., Fast Company, November 1995. • Focus on business processes • IT only useful if it helps people do work • A Lesson: The bigger the hype, the greater the chances of failure. • Techniques and tools of BPR can still be useful
The Next Big Thing The Fad That Forgot People, Davenport, T.H., Fast Company, November 1995. • Remember the lessons of BPR • Don’t drop all your current approaches for the “handsome newcomer” • Don’t listen to most charismatic advocates, listen to most reasoned advocates • Talk softly • Carry big ruler to measure real results
Defining Characteristics? • Statistical process control • Total quality management • Business process reengineering • Theory of constraints • Lean production methods • 6-Sigma • Lean/6-Sigma • Operations research & management science
Process Capacity O = RT (Little’s Law) • Recall flow basics • R=flow rate • T=flow time • O=occupancy • Process capacity = Maximum sustainable flow rate of a process • A resource pool is a set of interchangeable resources
How capacity gets used Idle Time Busy Unavailable
Find the bottleneck T1=6 mins T2=2 mins C1 = 2 units C2 = 1 units R1 = 2 / 6 = 0.333 pats/min = 20 pats/hr R2 = 1 / 2 = 0.5 patients/min = 30 pats/hr Bottleneck is first activity.
Finding the Bottleneck Not Easy • Complex business processes make finding bottlenecks far from easy • Process improvements can “shift the bottleneck” • GM and the C-More story
Problem 3.4 ER Flow Chart • Read Problem 3.4 on p69 • This is first problem on HW3 • Let’s draw the flow chart in iGrafx Process