Download
1 / 10
100 likes | 104 Vues
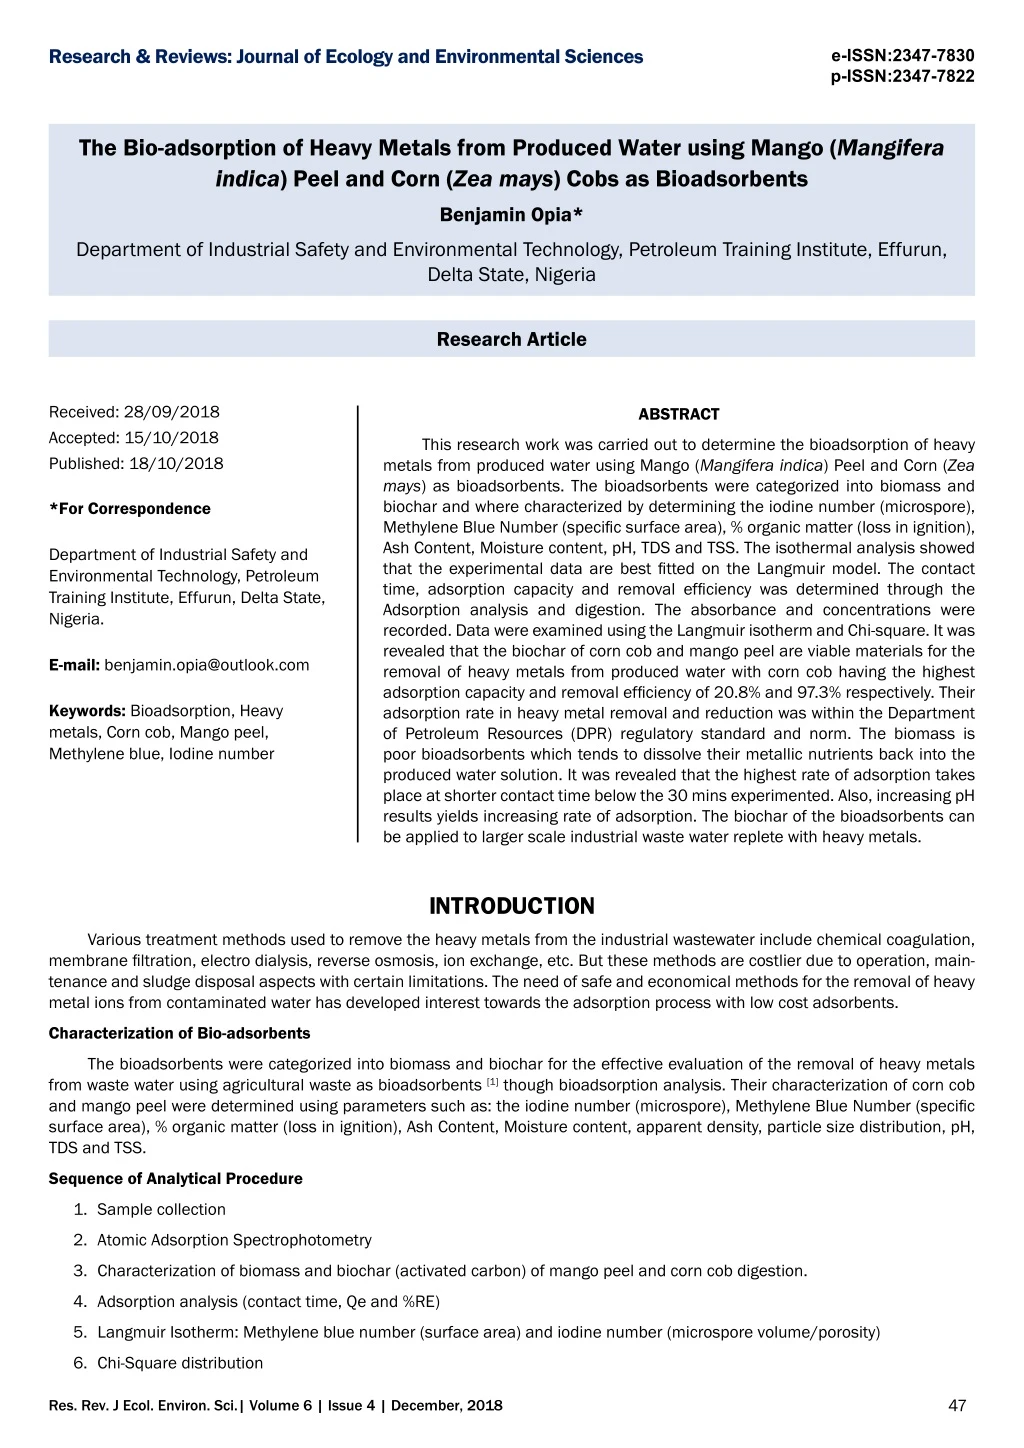
This research work was carried out to determine the bioadsorption of heavy metals from produced water using Mango (Mangifera indica) Peel and Corn (Zea mays) as bioadsorbents.

E N D
Research & Reviews: Journal of Ecology and Environmental Sciences e-ISSN:2347-7830 p-ISSN:2347-7822 The Bio-adsorption of Heavy Metals from Produced Water using Mango (Mangifera indica) Peel and Corn (Zea mays) Cobs as Bioadsorbents Benjamin Opia* Department of Industrial Safety and Environmental Technology, Petroleum Training Institute, Effurun, Delta State, Nigeria Research Article Received: 28/09/2018 Accepted: 15/10/2018 Published: 18/10/2018 ABSTRACT This research work was carried out to determine the bioadsorption of heavy metals from produced water using Mango (Mangifera indica) Peel and Corn (Zea mays) as bioadsorbents. The bioadsorbents were categorized into biomass and biochar and where characterized by determining the iodine number (microspore), Methylene Blue Number (specific surface area), % organic matter (loss in ignition), Ash Content, Moisture content, pH, TDS and TSS. The isothermal analysis showed that the experimental data are best fitted on the Langmuir model. The contact time, adsorption capacity and removal efficiency was determined through the Adsorption analysis and digestion. The absorbance and concentrations were recorded. Data were examined using the Langmuir isotherm and Chi-square. It was revealed that the biochar of corn cob and mango peel are viable materials for the removal of heavy metals from produced water with corn cob having the highest adsorption capacity and removal efficiency of 20.8% and 97.3% respectively. Their adsorption rate in heavy metal removal and reduction was within the Department of Petroleum Resources (DPR) regulatory standard and norm. The biomass is poor bioadsorbents which tends to dissolve their metallic nutrients back into the produced water solution. It was revealed that the highest rate of adsorption takes place at shorter contact time below the 30 mins experimented. Also, increasing pH results yields increasing rate of adsorption. The biochar of the bioadsorbents can be applied to larger scale industrial waste water replete with heavy metals. *For Correspondence Department of Industrial Safety and Environmental Technology, Petroleum Training Institute, Effurun, Delta State, Nigeria. E-mail:benjamin.opia@outlook.com Keywords: Bioadsorption, Heavy metals, Corn cob, Mango peel, Methylene blue, Iodine number INTRODUCTION Various treatment methods used to remove the heavy metals from the industrial wastewater include chemical coagulation, membrane filtration, electro dialysis, reverse osmosis, ion exchange, etc. But these methods are costlier due to operation, main- tenance and sludge disposal aspects with certain limitations. The need of safe and economical methods for the removal of heavy metal ions from contaminated water has developed interest towards the adsorption process with low cost adsorbents. Characterization of Bio-adsorbents The bioadsorbents were categorized into biomass and biochar for the effective evaluation of the removal of heavy metals from waste water using agricultural waste as bioadsorbents [1] though bioadsorption analysis. Their characterization of corn cob and mango peel were determined using parameters such as: the iodine number (microspore), Methylene Blue Number (specific surface area), % organic matter (loss in ignition), Ash Content, Moisture content, apparent density, particle size distribution, pH, TDS and TSS. Sequence of Analytical Procedure 1. Sample collection 2. Atomic Adsorption Spectrophotometry 3. Characterization of biomass and biochar (activated carbon) of mango peel and corn cob digestion. 4. Adsorption analysis (contact time, Qe and %RE) 5. Langmuir Isotherm: Methylene blue number (surface area) and iodine number (microspore volume/porosity) 6. Chi-Square distribution 47 Res. Rev. J Ecol. Environ. Sci.| Volume 6 | Issue 4 | December, 2018
Research & Reviews: Journal of Ecology and Environmental Sciences e-ISSN:2347-7830 p-ISSN:2347-7822 MATERIALS AND METHODS Source of Adsorbents/Sample Collection The Bioadsorbent Mango (Mangifera indica) peel was collected from the local Effurun market while the Corn (Zea mays) Cobs were collected from retail corn vendors along the P.T.I road junction in Uvwie L.G.A respectively. Biomass Bioadsorbent Sample Preparation (Non Modified) 1. Mango (Mangifera indica) peel: The mango fruit was collected from the market. The mango peel was separated from the edible and seed. The mango peel was sundried from about 3-7 days. It was ground into fine particles using the manual grinding machine. It was sieved to obtain 120 mm-240 mm (micrometre mesh) finer dust particles. The finer dust particles were oven dried at a temperature of 110°C for 30 minutes. The sample was preserved in a plastic storage bags. 2. Corn (Zea mays) cobs: The corn cob was collected from the local market. The corn cob was separated from the corn husk/hull and ear/seeds. The mango peel was sundried from about 2-4 days. The corn cob was crushed with a hammer. It was ground into fine particles using the manual grinding machine. It was sieved to obtain 100 mm-120 mm (micrometre mesh) finer dust particles. The finer dust particles were oven dried at a temperature of 110°C for 30 minutes. The sample was preserved in a plastic storage bags. Activation of Biomass to Activated Carbon The processed non-modified biomass of the mango peel and corn cob were subjected to the furnace at 400°C for 30min- utes. The muffle furnace was allowed to cool which was monitored through the temperature indicator on the muffle furnace. The respective samples were removed and placed in a desiccator for 24 hours to prevent its absorption of moisture from the atmo- sphere. Source of Adsorbate/Sample collection The Adsorbate (Produced water) was collected from floating production storage and offloading (FSPO) vessel Front Puffin located on Aje oil and gas field which is located on Oil block OML 113 offshore Nigeria. Aje field is in the western part of Nigeria in the Dahomey basin, 24 km (15 mi) from the coast and in water depths of 450 metres. Digestion Analysis of the Adsorbate (Produced water) Acid digestion involves the utilization of oxidizing acids and an external heat source to decompose the sample matrix. The choice of the acid or the combination of the acids depends upon the nature of the matrix to be decomposed. We used Perchloric acid (HClO4) + Nitric acid (HNO3) in a ratio of 1:5. The use of Perchloric acid is to dissolve/melt into the solution all the heavy par- ticles, organic matter/compound present in the adsorbate (Produced water) if any. Procedure 100 ml of the produced water in a cocked sample container was agitated by shaking vigorously. 3 ml of 1:5 ratio Perchloric acid: Nitric acid was added to the 100 ml produced water in a beaker and heated on a Bunsen burner to 20% dryness or to 20 ml volume. The 20 ml sample was transferred into a volumetric flask through filter paper and funnel. A wash bottle was used to rinse the beaker and poured back into the filter paper. The filter paper was also rinse and allowed to filter into the volumetric flask. The clear solution was diluted with distilled water to the 100 ml mark and preserved for AAS analysis. Adsorption Analysis A glass column with inner circle diameter of 2.2 cm was fitted with 5 g cotton wool and held firmly in a vertical position with the aid of a clamp fixed at one end to a retort stand (Figure 1). Atmospheric pressure helped to push the sample through the or- ganic material. Bioadsorption experiment was done by measuring 100 ml of the produced water sample and poured into a 250 ml conical flask. 10 g of the pre-treated fine particle bioadsorbent was added to the wastewater. The rate of adsorption was analysed with variable contact time of 30 to 60 minutes respectively. The height of the cotton wool (frit) in the class column was 10 cm3 and the tap out time of the treated sample was about 5 to 9 minutes. The adsorption capacity qe mg/g and removal efficiency Q were obtained according to the Equations 1 and 2. qe = (Co-Ce) V/W ……………………..… (%RE) or Q = (Co-Ce) × 100% /Co…..… Where V is the volume of the solution, (1) (2) W is the amount of adsorbent Co and Ce are initial and concentration of the solution after adsorption in mg/l. 48 Res. Rev. J Ecol. Environ. Sci.| Volume 6 | Issue 4 | December, 2018
Research & Reviews: Journal of Ecology and Environmental Sciences e-ISSN:2347-7830 p-ISSN:2347-7822 Figure 1. A Sketch diagram of experimental set-up [2]. RESULTS AND DISCUSSION Iodine Number The iodine number is the relative indicator of porosity in an activated carbon. A higher iodine number indicates higher micro- porosity of the sample [3] (Table 1). The iodine number of mango peel biomass could not be determined due to its organic tissues discharge interference during Iodine adsorption number (IAN) titration analysis. Mango biochar has a higher iodine number of 0.03225 which indicates a higher micro-porosity (Table 2). Corn cob biomass and biochar has an iodine number of 0.023 and 0.0308 respectively (Table 3). Table 1. Biomass characterization (physical and adsorption characteristics of powdered biomass obtained from mango peel and corn cob). S/N 1 2 3 4 5 6 7 8 9 10 PARAMETERS Iodine number Methylene blue number Specific Surface Area (10-3 km2 kg-1) Loss in ignition (% organic matter) Apparent Density (g/cm3) Ash content Moisture content pH Particle size distribution Particle size (mm) MANGO PEEL BIOMASS No end point 947 3006.754 98.56% 1.29 g/cm3 2.70% 75.30% 6 at 26°C 120>230>Finer Micro mesh 0.125 > 0.063 Millimetres CORN COB BIOMASS 0.023 mlM/g) 990 3143.28 99.06% 1.67 g/cm3 2.05% 76.40% 4 at 25°C 100mm>120 Micro mesh 0.149 > 0.125 Millimetres Table 2. Biochar characterization (physical and adsorption characteristics of powdered biochar (activated carbon) obtained from mango peel and corn cob). S/N 1 2 3 4 PARAMETERS Iodine number Methylene blue number Specific Surface Area (10-3 km2 kg-1) pH MANGO PEEL BIOCHAR 0.03225 mlM/g) 950 3016.279 8 at 28°C CORN COB BIOCHAR 0.0308 mlM/g) 970 3079.78 8 at 28°C Table 3. Estimation of surface area microspore/porosity content using iodine adsorption number for bioadsorbents. S/N 1 2 3 4 Sorbent Vb (cm3)(cm3)(cm3) 3.4 3.4 3.4 3.4 Vs (cm3) No end point 0.175 1.1 0.32 Ms 5 5 5 5 Ma 0.1 M 0.1 M 0.1 M 0.1 M IAN(mlM/g) Not determined 0.03225 0.023 0.0308 Mango peel Biomass Mango peel Biochar Corn cob Biomass Corn cob Biochar Note: The iodine adsorption number (IAN) was calculated with the formula: 49 Res. Rev. J Ecol. Environ. Sci.| Volume 6 | Issue 4 | December, 2018
Research & Reviews: Journal of Ecology and Environmental Sciences e-ISSN:2347-7830 p-ISSN:2347-7822 − Ms Vb Vs Ma ( ) = IAN 2 Where: Ms = molarity of thiosulphate solution (mol/dm3). Vs = volume of thiosulphate (cm3) used for titration of the PAC aliquot. Vb = volume of thiosulphate (cm3) used for blank titration. Ma = mass of AC (g). Bioadsorption Analysis Adsorption analysis conducted was based on; i. Concentration ii. Contact Time iii. Adsorption Capacity iv. Removal Efficiency Effect of Contact Time on the Removal of Heavy Metal Ions The effect of contact time on the adsorption capacity and the removal efficiency of heavy metals in this research work showed that the adsorption capacity was more effective at a shorter time of 0-30 minutes than from 30-60 minutes as shown in the graphs (Figures) below. The adsorption capacity of some of the removed heavy metals tends to reverse and dissolve back into the treated water solution mostly for non-modified biomass at a longer duration from 30-60 minutes [4]. The adsorption capacity increased as solution pH increased. Zinc, Zn removal: The biochar of corn and mango reduced the concentration of zinc from the produced water but the bio- mass of corn and mango increased the zinc content of the produced water by dissolving their fruity zinc nutrient into the produced water instead of adsorbing the zinc content for its removal from the produced water. There was a continuous increase in the zinc content of the biomass of corn cob and mango peel from 30 minutes to 60 minutes (Figure 2). Iron, Fe removal: The iron content was reduced from the produced water by the biochar of corn cob and mango from 0 min- utes to 30 minutes but slightly started to increase again from 30-60 minutes. For Biomass of mango peel, Fe increased from 0 minutes to 30 minutes and massively from 30 minutes to 60 minutes’ indication a reversed adsorption capacity which shows that the mango peel was dissolving back its iron (Fe) nutrient into the produced water (Figure 3). This explains the literature review that stated that the use of untreated agricultural wastes as adsorbents can also fetch a number of problems such as poor adsorption ability which is due to discharge of soluble organic compounds contained in the plant materials [5]. Furthermore, the corn biomass reduced iron (Fe) only slight from 0 minutes-30 minutes and increased above the initial Fe concentration. Figure 2. Graph of zinc concentration against time. 50 Res. Rev. J Ecol. Environ. Sci.| Volume 6 | Issue 4 | December, 2018
Research & Reviews: Journal of Ecology and Environmental Sciences e-ISSN:2347-7830 p-ISSN:2347-7822 Figure 3. Graph of iron concentration against time. Copper, Cu removal: The biomass of corn cob with that of the biochar of mango peel and corn cob removed all Copper con- tent from the produced water from 0 to 30 minutes and from 30 minutes to 60 minutes. Thus, showing a high level of adsorption capacity and removal efficiency. The mango biomass reduced all the copper content from the produced water from 0-30 minutes and reversed back the reaction from 30-60 minutes. Thus, showing poor adsorption capacity and removal efficiency from 30-60 minutes by dissolving its own Cu nutrients with the formerly adsorbed Cu back into the solution. Thus, indicating that mango bio- mass has a very high content of Copper (Cu) content in its nutritional composition. It also showed that mango biomass can only be effective for a shorter contact time below 30 minutes (Figure 4). Chromium, Cr Removal: There was no observable effect on the removal of Chromium by the biomass and biochar of mango peel and corn cob. Their respective adsorption capacities and removal efficiency was zero (Figure 5). Figure 4. Graph of copper concentration against time. Figure 5. Graph of chromium concentration against time. Nickel, Ni removal: There was total removal of Nickel (Ni) from the produced water by the biomass and biochar of mango peel and corn cob. Their adsorption capacities and removal efficiency were 0.05 mg/g and 83.333% respectively (Figure 6). 51 Res. Rev. J Ecol. Environ. Sci.| Volume 6 | Issue 4 | December, 2018
Research & Reviews: Journal of Ecology and Environmental Sciences e-ISSN:2347-7830 p-ISSN:2347-7822 Figure 6. Graph of nickel concentration against time. Lead (Pb), Cadmium (Cd) and Mercury (Hg) removal: There was no observable adsorption capacity and removal efficiency of Lead (Pb), Cadmium (Cd) and Mercury (Hg) because their readings were so small and insignificant as recorded from the initial concentration of the untreated produced water in ppm which showed readings such as <0.001 mg/l and not 0.0 mg/l. Thus, in- dicating that the readings were as a result of the equipment’s minimum detection limit in ppm. There may be readings found in ppb (Parts per billion) (Figures 7-9). Figure 7. Graph of lead concentration against time. Figure 8. Graph of cadmium concentration against time. 52 Res. Rev. J Ecol. Environ. Sci.| Volume 6 | Issue 4 | December, 2018
Research & Reviews: Journal of Ecology and Environmental Sciences e-ISSN:2347-7830 p-ISSN:2347-7822 Figure 9. Graph of mercury concentration against time. Contact Time Concentrations (Table 4) Table 4. Values of heavy metal adsorption capacities in concentration (mg/g) compared with the bioadsorbents (biomass and activated carbon) and the adsorbate (produced water). S/No. Samples Concentration Cu Zn Fe Cr Ni Pd Cd Hg Adsorbate (Produced water) Bioadsorbents Mango peel biomass (30mins) Mango peel biomass (1hr) Mango peel biochar (30mins) Mango peel biochar (1hr) Corn cob biomass (30 min) Corn cob biomass (1hr) Corn cob biochar (30mins) Corn cob biochar (1hr) 1 0.013 2.1588 0.038 0.011 0.006 <0.001 <0.001 <0.001 2 3 4 5 6 7 8 9 0.266 0.8372 <0.001 <0.001 0.0647 0.3395 <0.001 <0.001 3.4893 7.8097 0.1845 0.485 1.8155 2.2303 0.0701 0.2418 <0.001 0.0404 <0.001 <0.001 <0.001 <0.001 <0.001 <0.001 0.011 0.011 0.011 0.011 0.011 0.011 0.011 0.011 <0.001 <0.001 <0.001 <0.001 <0.001 <0.001 <0.001 <0.001 <0.001 <0.001 <0.001 <0.001 <0.001 <0.001 <0.001 <0.001 <0.001 <0.001 <0.001 <0.001 <0.001 <0.001 <0.001 <0.001 <0.001 <0.001 <0.001 <0.001 <0.001 <0.001 <0.001 <0.001 Methylene Blue Number Methylene blue number is the measure of the mesoporous content of the activated carbon and the Langmuir equation is used to calculate the specific area of the sorbents [3,6]. Corn bob biomass and biochar has a higher methylene blue number of 990 and 970 with a specific surface area of 3143.280 (10-3 km2 kg-1) and 3079.780 (10-3 km2 kg-1) respectively. While Mango biochar has a methylene blue number of 950 with specific surface area of 3016.279 (10-3 km2 kg-1) while the least is mango biomass with a methylene blue number of 947 with specific surface area of 3006.754 (10-3 km2 kg-1). Langmuir Isotherm Equation (Table 5) Table 5. Parameter values of the isotherms adsorption of methylene blue onto activated carbon and biomass from bioadsorbents. S/N 1 2 3 4 Bioadsorbents Mango peel biomass Mango peel biochar Corn cob biomass Corn cob biochar Langmuir Isotherm Equation y = 0.0013 × - 0.0522 y = 0.0011 × - 0.0582 y = 0.0013 × - 0.0116 y = 0.0003 ×+ 0.0458 R2 Adsorption Capacity Qe(mg/g) 947 950 990 970 R2 = 0.9919 R2 = 0.9392 R2 = 0.9994 R2 = 0.8137 Adsorption Capacity The activated carbon (biochar) sample of the bioadsorbent was more effective in the removal of heavy metal ions from the adsorbate (produced water) than its non-modified biomass samples. Both Corn cob biochar and mango peel biochar at 30 minutes and 60 minutes has almost same adsorption capacity readings except for iron (Fe) where corn cob biochar for both 30 minutes and 60 minutes where 20.89 mg/g and 19.17 mg/g respectively while the mango biochar for both 30 minutes and 60 minutes where both 19.74 mg/g and 16.74 mg/g respectively which showed that the corn cob biochar (activated carbon) has the highest adsorption capacity. The biochar of corn cob and mango peel removed more of the heavy metal ions to a non-significant level from the produced water than their respective biomass [2]. Removal Efficiency The removal efficiency for copper by almost all the bioadsorbent samples was very high except for mango peel biomass at 60 minutes which was very poor due its reversed adsorption reaction and also its tendency of dissolving its own Copper (Cu) nutri- ent into the adsorbate. Thus, increasing the post copper concentration of the supposed treated adsorbate by adding up its own 53 Res. Rev. J Ecol. Environ. Sci.| Volume 6 | Issue 4 | December, 2018
Research & Reviews: Journal of Ecology and Environmental Sciences e-ISSN:2347-7830 p-ISSN:2347-7822 copper nutrient content to the initially adsorbed copper from the adsorbate which was lost back into the solution through loose bonding and delayed contact time. Thereby increasing the copper concentration of the treated adsorbate even more than the initial concentration in the adsorbate (produced water). In general, the activated carbons (biochar) of mango peel and corn cob at 30 minutes and 60 minutes had the highest removal efficiency than their biomass samples with corn cob having the higher re- moval efficiency of 96.75% and 88.80% for 30 minutes and 60 minutes respectively to that of mango peel of 91.45% and 77.53% respectively for iron (Fe) concentration. The biochar of mango peel and corn cob has the same removal efficiency for zinc (Zn) at same time intervals of 30 minutes and 60 minutes respectively. All samples of the bioadsorbent have same removal efficiency for Nickel (Ni) at 83.33% and zero removal efficiency for Chromium (Cr). The removal efficiency for Lead (Pb), Cadmium (Cd) and Mercury (Mg) could not be determined due to its very low or no concentration which could not be detected within the equipment’s minimum detection limits [2]. Specific Surface Areas (Table 6) Table 6. Measurement of the adsorption capacity qe mg/g and removal efficiency q (%re) and specific surface areas of pyrolized adsorbents by methylene blue adsorption (smb). Concentration of solution before adsorption Co=1000 mg/L, Ma = 0.01 g, V= 0.01 L. Absorbance Ce/Qe (g/l) at equilibrium -0.05 -0.052 -0.01 0.045 Concentration of solution after Adsorption Ce(mg/l) 53mg/l 50mg/l 10mg/l 30mg/l Adsorption Capacity qe(mg/g) 947 950 990 970 Removal Efficiency %RE 94.7 95 99 97 Specific Surface Areas SMB (10-3 km2kg-1) 3006.754 3016.279 3143.28 3079.78 Co-Ce (mg/l) S/No. Bioadsorbents 1 2 3 4 Mango peel biomass Mango peel biochar Corn cob biomass Corn cob biochar 947mg/l 950mg/l 990mg/l 970mg/l Note − × × × a 20 ( N MB N M 10 ) g = S Specific Surface Areas of pyrolized adsorbents MB Ng= The amount of methylene blue adsorbed at the monolayer of sorbents in kg kg-1. (In this research we defined experimen- tal qe as NM, which is the amount methylene blue adsorbed at the monolayer of sorbents in mg/g or 10-3 kg/kg), aMB = The occupied surface area of one molecule of methylene blue =197.2 Å2. N =Avogadro’s number, 6.02 × 10²³ mol-1; and M = the molecular weight of methylene blue, 373.9 × 10⁻³ Kg mol-1. Effect of pH Value on Removal of Heavy Metal Ions The pH of the solution has a significant impact on the uptake of heavy metals since it determines the surface charge of the adsorbent, the degree of ionization and speciation of the adsorbate. Lower pH reduces adsorption due to more H+ ions competing with the metal ions for adsorption while higher pH increases adsorption of metal ions because lesser H+ would be competing with metal ions for adsorption sites. The pH of the adsorbent is an important factor in adsorption processes. The adsorption capac- ity increases as solution pH increases. This was observed due to the variations in the adsorption capacity of bioadsorbents with increasing pH [2]. The pH of both mangoes peels and corn cob activated carbons (biochar) was 8 at 28°C respectively. While the biomass of mango peel was at pH6 at 26°C and corn cob pH 4 at 25°C respectively. It is clear that metal ions were effectively adsorbed be- tween the pH ranges of 4-8, with the maximum adsorption of metal ions using mango peel and corn bob biochar occurring at pH 8, respectively. According to my results it was observed that the heavy metal removal by the biochar of the adsorbents increased significantly as the pH of the solution increased from 4-8. Spent Biochar pH Properties The pH of the spent corn cob biochar and mango peel biochar were 7 and 8 respectively. They are both Neutral/alkaline respectively and not acidic. Biochar are used to modify the soil to yield high level fertility. Biochar is an ancient soil improvement technique whereby charcoal is dug into the soil, where it soaks up water/nutrients and improves soil fertility. Its highly porous structure can act like a slow-release 'sponge' for water and useful soil nutrients [6]. Spent Non-Modified Biomass pH Properties The spent non-modified biomass of corn cob and mango peel had a pH of 6 and 4 respectively thus acidic. Treated Bioadsorbates (Produced water) pH The treated Produced water through Corn Cob Biochar had a pH of 7 thus neutral. The Treated Produced water through Mango peel Biochar had a pH of 8 thus alkaline. The Treated Produced water through Corn Cob Biomass had a pH of 6, thus slightly acidic. The Treated Produced water through Mango Peel Biomass had a pH of 5, thus acidic. 54 Res. Rev. J Ecol. Environ. Sci.| Volume 6 | Issue 4 | December, 2018
Research & Reviews: Journal of Ecology and Environmental Sciences e-ISSN:2347-7830 p-ISSN:2347-7822 Chi-Square The comparative results were determined using Chi-Square to test whether there was significant difference in the removal of heavy metals from the produced water in the 8 treated adsorbate samples by the bioadsorbents between Mango (Mangifera indi- ca) peel and Corn (Zea mays) Cobs [7-13]. In the test hypothesis it was observed that the X2 calculated fell in the lower critical region which is a rejection of the null hypothesis (Ho) and the acceptance of the alternate hypothesis (Ha). Therefore, it was concluded that there was significant difference in the removal of heavy metals [14-17] from the produced water in the 8 treated samples (adsor- bates) by the bioadsorbents of Mango (Mangifera indica) peel and Corn (Zea mays) Cobs at 5 % level of significance (Figure 10). Figure 10. Chi-Square distribution. Decision rule Reject < > = Ho if 2 2 0.025 2 2 0.0975, 56 X X or X X 78.6 CONCLUSION Since X2 calculated falls in lower critical region, we will reject the null hypothesis (Ho) and accept the alternate (Ha). The Test hypothesis showed that Chi-square-calculated (5.96) < X2 0.025, 56=37.2 and it lies in the lower critical region. It was therefore concluded that there was a significant difference in the removal of heavy metal from the produced water in the 8 samples (bio- mass and biochar of mango peel and corn cob at 30 minutes and 60 minutes respectively) at 5% level of significance. Data comparison with DPR Post-treated Produced Water Regulatory Standard (Table 7) Table 7. Comparing the bioadsorption post analysis data with department of petroleum resources physical, chemical, and biological characteristics of the post–treated produced water regulatory standard. Corn Cob Biomass at 30 mins 6 53.64 3.5 0.011 <0.001 <0.001 <0.001 <0.001 0.0647 <0.001 1.8155 Corn Cob Biochar at 30 mins 7 6.96 0.72 0.011 <0.001 <0.001 <0.001 <0.001 <0.001 <0.001 0.0701 Mango peel biomass at 30 mins 5 44.92 3.7 0.011 <0.001 <0.001 <0.001 <0.001 0.266 <0.001 3.4893 Mango peel biochar at 30 mins 8 10.86 0.68 0.011 <0.001 <0.001 <0.001 <0.001 <0.001 <0.001 0.1845 Parameters Unit DPR Limit Produced Water pH TDS TSS Cr Cd Cu Ni Pb Zn Hg Fe - 6.5-8.5 5000 50 0.5 - - - 5 - - 7.84 25502.4 3.04 0.011 <0.001 0.038 0.006 <0.001 0.013 <0.001 2.1588 mg/L mg/L mg/L mg/L mg/L mg/L mg/L mg/L mg/L mg/L The Physicochemical properties of produced water was determined quantitatively and the bioadsorbents were characterized with parameters such as Iodine number, Methylene blue number, Specific Surface Area (10-3 km2kg-1), Loss in ignition (% organic matter), Apparent Density (g/cm3), Ash content, Moisture content, pH, Particle size distribution and Particle size (mm). The rate of concentration, contact time, adsorption capacity, removal efficiency and pH for the bioadsorption of Cr, Cd, Cu, Ni, Pb, Zn, Fe and Hg from the produced water were determined in an adsorption analysis using Mango (Mangifera indica) peel and Corn (Zea mays) Cobs as bioadsorbents for the removal of the outlined heavy metals. The activated carbon (biochar) of both bioadsorbents had a higher percentage removal efficiency and adsorption capacity of metal ions than their non-modified biomass bioadsorbents. The removal of metal ions increased with increasing pH. The effect of contact time on the adsorption rate of metal ion concentration and percentage removal efficiency at different time intervals (0,30,60 min) revealed that adsorption/removal of heavy metal ions were rapid and best achieved at a shorter time interval of 30 minutes or lesser. This research showed that the biochar (activated carbon) of mango peel and corn cob (agricultural by-products/wastes) are viable materials for the removal of heavy metals from produced water and therefore can be applied to large scale industrial waste waters replete with heavy metals. 55 Res. Rev. J Ecol. Environ. Sci.| Volume 6 | Issue 4 | December, 2018
Research & Reviews: Journal of Ecology and Environmental Sciences e-ISSN:2347-7830 p-ISSN:2347-7822 Comparatively, the biochar (activated carbon) of corn cob has a higher adsorption capacity and removal efficiency of heavy metals from produced water than the biochar of mango peel. Langmuir isotherm showed that the experimental data are best fitted on the Langmuir model. Finally, The Test hypothesis showed that Chi-square- calculated (5.96) < X2 0.025, 56 = 37.2 and it falls in the lower critical region indicating a significant difference in the removal of heavy metal from the produced water at 5% level of significance. CONFLICT OF INTEREST The methodology for the analysis to determine the Methylene Blue Number of bioadsorbents using10mL of the dye with high concentrations of 10 mg L-1, 25 mg L-1, 50 mg L-1, 100 mg L-1, 500 and 1000 mg L-1 using a UV/Vis Spectrophotometer at a wavelength of 645 nm [18] could not be determined. It could not give a straight line graph. The graph was scattered thus, did not obey beer lamberts law. Beer Lamberts principle only works at low concentrations. We have to introduce a dilution factor of 100 to dilute the samples for UV Spectrophotometric analysis. RECOMMENDATION The contact time for adsorption analysis should be conducted at short time intervals. Bioadsorbents should be modified to have a higher pH of 7 and 8 for increased adsorption capacities and percentage removal efficiencies. Non-modified biomass should be modified through acidizing and neutralized before use. Increase in pH results in the increased adsorption capacity and removal efficiency. There was fermentation of the used biomass adsorbate after days of the analysis. If discharged into water bodies, this can increase the COD, BOD and TOC of a water body and can cause diminution of dissolved oxygen (DO) content in water and can make threats to the aquatic life. The already spent activated carbon (biochar) can be used for soil modification and improvement for agricultural purposes because Biochar is an ancient soil improvement technique. REFERENCES 1. Sud D, et al. Agricultural waste material as potential adsorbent for sequestering heavy metal ions from aqueous solutions-A review. Bioresour Technol. 2008;99:6017-6027. 2. Agbozu IE, et al. Batch adsorption of heavy metals (Cu, Pb, Fe, Cr and Cd) from aqueous solutions using coconut husk. Afr J Environ Sci Technol. 2014;8:239-246. 3. Itodo AU, et al. Application of methylene blue and iodine adsorption in the measurement of specific surface area by four acid and salt treated activated carbons. NY Sci J. 2010;3:25-33. 4. Malik DS, et al. Removal of heavy metals from emerging cellulosic low-cost adsorbents: a review. Appl Water Sci. 2017;7:2113-2136. 5. Uwagboe Ayoku Isaac. Modern analytical methods for testing plant, soil and water samples. 2011. 6. Downie, A, et al. Physical properties of Biochar, in Lehmann, J. and Joseph, S. (editors), Biochar for Environmental Management, Earthscan, London: 2009;13-32. 7. Tripathi A, et al. Heavy metal removal from wastewater using low cost adsorbents. J Biorem Biodegrad. 2015;6:5. 8. Ray JP, et al. Produced water-technological/environmental issues and solutions. Plenum Press, New York and London. 1992. 9. Strømgren T, et al. Acute toxic effects of produced water in relation to chemical composition and dispersion. Mar EnvironRes. 1995;40:147-169. 10. Kumar U. Agricultural products and by-products as a low cost adsorbent for heavy metal removal from water and wastewater: A review. Sci Res Essays. 2006;1:33-37. 11. Pillard DA, et al. Estimating the acute toxicity of produced waters to marine organisms using predictive toxicity models. Springer. 1996;49-59. 12. Nature Technology Group. Introduction to produced water treatment. nature technology solutions. 2005;2-18. 13. Hima KA, et al. Biosorption: An eco-friendly alternative for heavy metal removal. Afr J Biotechnol. 2007;6:2924-2931. 14. Grant A, et al. Toxicity of sediments from around a North Sea oil platform: are metals or hydrocarbons responsible for ecological impacts. Mar Environ Res. 2002;53:95-116. 15. Gadd MG. Heavy metal and radionuclide uptake by fungi and yeasts. Biohydrometallurgy. 1988. 16. Demirbas A. Heavy metal adsorption onto agro-based waste materials: a review. Journal of hazardous materials. 2008;157:220-229. 17. Ahalya N, et al. Biosorption of heavy metals. Res Chem Environ. 2003;7:71-79. 18. Nunes CA, et al. Estimation of surface area and pore volume of activated carbons by methylene blue and iodine numbers. Quim Nova. 2011;34:47247-6. 56 Res. Rev. J Ecol. Environ. Sci.| Volume 6 | Issue 4 | December, 2018

![LS6K1 [ Lilium longiflorum ]](https://cdn1.slideserve.com/3565649/slide1-dt.jpg)