Download
1 / 20
200 likes | 226 Vues
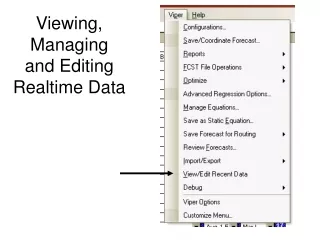
Interface for viewing, managing, and editing realtime data with options to estimate missing values, adjust predictors, and handle outliers for accurate analysis.

E N D
1971-2000 normals User entered values Original values from database
When you refresh data If no edited data exists The latest value from database becomes the “original” If an edit exists If the new database value is the same as “original” then edit is kept If an edit exists If the new database value is NOT the same as “original” then the program asks what to do 1971-2000 normals User entered values Original values from database
The main interface could be used to estimate missing values Anything can be a predictor/predictand
However, the forecast vs observed scatterplot is only a general summary of the results, not that useful if you want to know the forecast equation itself.
Here, the cross correlation graph (to the right of main interface) helps East Rim Divide (predictor 1) SWE (inches) Given East Rim Divide, what should Gros Ventre Summit (Final Predictand) be?
Example: January precipitation from Loomis Park is missing. Elevation 13800’ 10350’ 8650’ 7000’ Streamgage 5200’
Load nearby stations as predictors Set target months Inspect predictor quality Is there a wide spread in the individual station predictions? The closest site has the worst correlation? Perhaps there’s an outlier?
East Rim Divide versus Loomis Park January Precipitation An outlier!
Gros Ventre Summit versus Loomis Park January Precipitation 1985 isn’t an outlier here so maybe East Rim is bad
Our options FIX THE DATABASE!!!! Exclude East Rim from analysis Manually edit East Rim’s station sheet data
Our options FIX THE DATABASE!!!! Exclude East Rim from analysis Manually edit East Rim’s station sheet data Limit the years of the analysis If other predictors are missing 1985, require serial completeness (under “Advanced Regression Options”)
With east rim divide fixed the scatter plot looks ok… The prediction is around 4.3” +/- 0.5”
Enter 4.3” (or your value) here. Actual value 4.2”… Not bad!
When running static equations, viper will alert you to missing data
Options: “Smart Skip” to not evaluate any equation that needs this data “Use Averages” uses 1971-2000 normal in place of real data Enter a “new value” Stored temporarily or permanently based on this checkbox
Into the station data sheet If you need to edit some data, it might also be to the right
External CSV files have the same format as the station data sheet
Sometimes the 1971-2000 normal stored in the database is wrong. Your options…. 1: FIX THE DATABASE!!!!!! 2: Go to the “averages” worksheet and manually enter your values