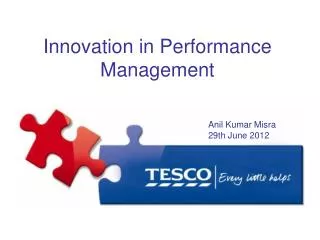
Performance Management in VELUX
250 likes | 339 Vues
Learn about the successful performance management transformation at VELUX through adaptive processes, global targets alignment, and financial modeling. Explore the benefits of leaving traditional budgeting behind and adopting a forward-looking approach.

Performance Management in VELUX
E N D
Presentation Transcript
Performance Management in VELUX BBRT meeting 3 November 2015 Ulrich Gammelgaard
A few facts aboutme…. Ulrich Gammelgaard 13 years with VELUX • Head of Global Financial Management • Financial management • Business Partnering • Planning and Analysis • Product costing • Business Intelligence
VELUX RoofWindow • VELUX roofwindowwasdeveloped and named in 1942 • for ventilation and for light • Vision: ”To develop a roofwindowwhich in anyaspect is as good as the bestverticalwindow” • The pivot hingewasdeveloped in 1945
Financial Management in VELUX • Global Finance transformation in 2012-2013: How can Finance create more value for Business? • Performance Management without budgets from 2014: • Accountability • Agility • Transparency
VELUX finance organisation -> 2012 Before transition VELUX had 55+ separate financefunctionsin and being part of localgroupfunctions, sales- or productioncompanies Eastern Europe 16 Countries 6 PCOs 16 SCOs Western Europe 12 Countries 13 PCOs 12 SCOs VFC + Group Americas 4 Countries 1 PCOs 4 SCOs Asia 4 Countries 1 PCOs 4 SCOs PCOs = Productioncompanies SCOs = Sales companies
Moving from 50+ financedepartments to one global finance organisation in VELUX VELUX Global Finance
VELUX Performance Model Wholesales & support Production companies Sales companies Sales prices Gross/Net turnover Trade conditions Products Production standard costs Product mix Customers Raw materials Logistic standard costs Other prod. cost Sales channels Product mix Contribution I Local marketing cost Contribution II Group costs: D&D, Group-IT, Corporate marketing, Common logistics, HR, Finance, Group management etc. Local cost of sales, overhead et. Purchase price variance Market contribution Material variance Labor variance Allocated Group cost Overhead costs variance Depreciation cost variance Market EBIT Other variance Group cost variance Sum of all Market EBIT Group EBIT
VELUX Performance Process • : We decided to leave the traditional budgeting process behind us • : We decided to implement a new common financial performance process in all of VELUXwith distinct: • Target setting • Forecasting • Resource allocation
We go beyond budgeting! Past: Traditional budget planning once a year... Future: Adaptive process with target setting and rolling forecasting... Yearly Target setting • : One yearly planning process • : Monthly follow up on deviations Monthly Forecasting Resource allocation Daily
What’s in it for VELUX? With VELUX Performance Process we introduce a synchronised “beat of the pulse” for planning and follow up in VELUX. -> Alignment of global targets with local targets -> Agility in planning with possibility for monthly reviews -> Forward looking follow-up on target realisation
VELUX Performance Process 1: Global target setting 2: Break-down of targets 3: Plan to reach target 4: Monitor and follow-up
VELUX Performance Model Production companies Sales companies Group support Sales prices Gross/Net turnover Trade conditions Production standard costs Product mix Products Raw materials Logistic standard costs Customers Other prod. cost Product mix Contribution I Sales channels Local marketing cost Contribution II DAGC: D&D, Group-IT, Corporate marketing, Common logistics, HR, Finance, Group management etc. Local cost of sales, overhead et. Purchase price variance Market contribution Allocated DAGC Material variance Labour variance Market EBIT Overhead costs variance Depreciation cost variance Sum of all Market EBIT Other variance Group cost variance Group EBIT
VELUX Performance Model Production companies Sales companies Group support Sales prices Gross/Net turnover Trade conditions Production standard costs Product mix Target Products Raw materials Logistic standard costs Customers Other prod. cost Target Product mix Contribution I Sales channels Local marketing cost Contribution II DAGC: D&D, Group-IT, Corporate marketing, Common logistics, HR, Finance, Group management etc. Local cost of sales, overhead et. Target Purchase price variance Target Market contribution Allocated DAGC Material variance Labour variance Market EBIT Overhead costs variance Depreciation cost variance Sum of all Market EBIT Other variance Group cost variance Target Group EBIT
Financial Target-KPI’s = Sales Companies Market Contribution-% Production costs development (standard cost + variances YoY) Production Companies = Logistic costs development (standard cost + variances YoY) = Logistics = DAGC in % of net sales Support & Group Systems Group: VELUX EBIT-%
New process and new roles • For all business units (in SCo, PCo, Business Support and in PRD) management have to organise a monthlyprocessfollowing the “beat of the pulse” in VELUX • New simulation tools has beendeveloped to support financialplanning and monthlyforecasting • Follow-up on financialKPI’s for targetsettingwillbe done in user-friendlydash-boards, showingactualdevelopment, targetsand updatedforecasts for currentyear and nextyear • All Finance Managers have beentrained in thesetools and willback-up the localprocess of planning and follow-up.
Monthlyprocess Beginning of month • Everymonth a “window” willbe open for financialplanning and forecasting in the new simulation tool. • Based upon the actualfiguresyear to date/trends for last 12 months etc. you as manager have to decideiftherewillbechanges to: • Expectations for unit sales • Expectedchanges in pricing (GSP, discounts) • Expectations to costdevelopment • Investment activity • Etc… • When a forecast is submitted, data willbeavailable in the monthlydashboards for relevant stakeholders • Managers shouldanchor the monthlyforecastingprocess in the local management team (monthly meetings etc.), using the finance manager/finance business partner as “expert” in using the tools and support decision making. Actual data available in dashboards Planning window Submit forecast End of month
System view: Rolling forecasting • Monthlyforecasting rolling for currentyear and nextyear • BPC on SAP Hana technologyallows real time simulation of full P&L, supported by statisticalforecasting with ”big data” • Scenario analysis as an option before a forecast is ”submitted” • Seamless integration from sales forecasting to productionplanning and logistics operations (One forecast) Forecasting
System view: Rolling forecasting • Performance data incl. rolling forecast data available in dashboards for all business units/accountable managers • Trend focus with “story line” looking forward in terms of expected performance (sales, financials) • Risks and initiatives in relation to expected performance are included Dashboards Trend focus Risks/initiaves
Dashboard Market Performance Rolling 12 months average and trend lines shows historicaldevelopment up againstcurrentforecasts. Target-KPI has a predominant position Commentary, initiatives and risksincluded Layout optimized for Ipad
Dashboard Market Performance Initiatives to reachtargetsareincluded to provide a more operational/strategic (howeverpragmatic) dicussionabout plans/expectations
Dashboard Market Performance • Focus on actual and expected performance • Trends and rolling 12 month average graphics
VELUX Performance Process 1: Global target setting 2: Break-down of targets 3: Plan to reach target 4: Monitor and follow-up