Download
1 / 24
240 likes | 260 Vues
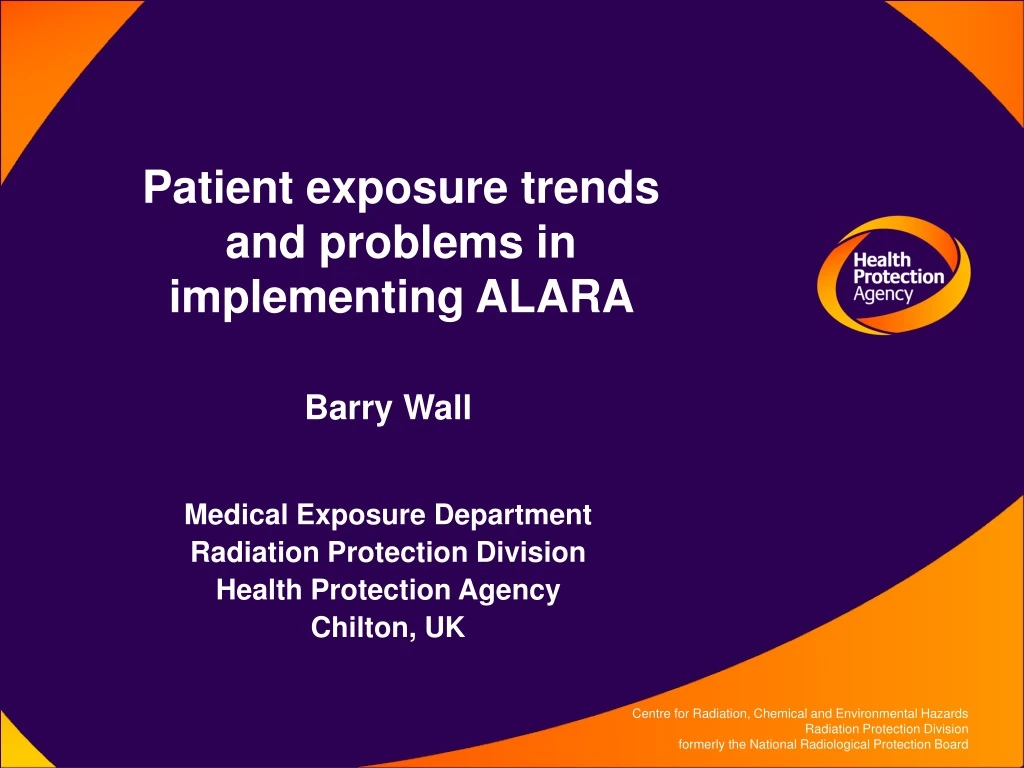
This article explores the uses of radiation in medicine, the increasing radiation doses and risks, recent developments in medical imaging, patient dose measurement methods, radiation protection principles, and trends in UK diagnostic reference levels (DRLs) for radiography and exams.

E N D
Patient exposure trends and problems in implementing ALARA Barry Wall Medical Exposure Department Radiation Protection Division Health Protection Agency Chilton, UK
Uses of radiation in medicine • Medical radiology • X-ray imaging for diagnosis • X-ray imaging to guide therapeutic interventions • Radionuclide imaging (nuclear medicine) • Radiotherapy Together 99% of man-made population dose
Radiography Fluoroscopy Computed Tomography Medical X-ray Imaging Effective dose Cancer risk <1 in a million 10 µSv Radiation doses & risks increasing ~ 1 in 1000 20 mSv
X-ray examinationsin 4 dose bands Effective dose Typical % of total % of total range (mSv) x-ray exams no. of exams collective dose <0.02Radiography of 73 1 chest, limbs, teeth 0.02 - 0.2 Radiography of 5 1 head, neck, joints 0.2 - 2.0 Radiography of spine, 16 20 abdomen, pelvis 2 - 20 CT, angiography, 6 78 contrast studies of GI, biliary & urinary tracts
Interventional Angiography CT body Ba enema (colon) Ba meal (stomach) IVU (urinary tract) CT head Lumbar spine Thoracic spine Pelvis / hip Abdomen Skull Chest 0 5 10 15 20 Effective dose, mSv Typical Effective Doses from X-ray Procedures Highest dose band
Conventional Radiography Images of bones obtained on film sandwiched between intensifying screens in cassette below patient couch
Conventional Fluoroscopy Ba study of colon Image intensifier
Digital fluoroscopy Image intensifier or flat panel detector moving digital images and DSA Recent developments in medical imaging Digital radiography Storage phosphors or flat-panel detectors static digital images Amorphous selenium coating over TFT matrix
3D images with 0.6 mm isotropic spatial resolution Recent developments in medical imaging Multi-slice helical CT Up to 64 rows of detectors across beam 0.5 s rotation time
Prolonged fluoroscopy with static x-ray beam can produce tissue reactions Recent developments in medical imaging Increasing use of fluoroscopy-guided key-hole surgery by non-radiology clinicians (eg. cardiologists)
Radiography Entrance surface dose (ESD) Fluoroscopy Dose-area product (DAP) CT CT dose index (CTDI) Patient Dose Measurement Methods Direct measurements can only be made in x-ray beam outside the patient 38507, 29033, 29037
CT examinations Calculation of organ doses Simulate x-ray exams on mathematical phantoms and follow tracks of millions of x-ray photons through phantom Calculate energy deposited in each organ & external dosemeter to derive coefficients relating organ doses to the measurable dosequantities (ESD, DAP or CTDI) Conventional X-ray exams Family of phantoms Baby 1y 5y 10y 15y Adult
60 45 Frequency 30 15 0 0 10 20 30 40 Entrance surface dose per film, mGy 1983 NRPB Patient Dose Survey Abdomen AP Best hospital Worst hospital 22834
Radiation protection principlesfor medical exposures Justification Optimisation But no dose limits
Optimisation of medical exposures X-ray equipment and techniques should be selected to ensure that patient exposures are ALARA consistent with obtaining the required diagnostic information How?
DRLs - the first step to ALARA Patient exposures cannot be reduced indefinitely without impact on image quality Radiologists subjectively assess the adequacy of their images every time they report on them but they cannot intuitively assess the patient dose (particularly with modern digital systems) DRLs provide a means for alerting radiologists when their patient doses become unusually high
DRLs - the first step to ALARA Concept of DRLs recognised in: - ICRP Publications 60 (1991) & 73 (1996) - IAEA BSS (1994) - EC Medical Exposure Directive (1997) DRLs usually set at 3rd quartile of dose distributions seen in national patient dose surveys Hospitals with mean doses > DRL should investigate why and take corrective action, if not clinically justified DRLs are ‘investigation levels’ triggering further optimisation where most urgently needed.
DRLs - the first step to ALARA On exceeding DRL, the subsequent investigation will involve detailed analysis of existing routine performance tests on the x-ray equipment (that include simple image quality checks) [e.g. IPEM Report 91] and reference to international guidance on good imaging techniques:- e.g. in European Guidelines on Quality Criteria for adult and paediatric radiography and CT
Trends in UK DRLs for radiographs (1985 - 2000) Radiograph Entrance Surface Dose (mGy) . 1985 1995 2000 Skull AP/PA 5 4 3 Skull LAT 3 2 1.5 Chest PA 0.3 0.2 0.2 Chest LAT 1.5 0.7 1 Thoracic spine AP 7 5 3.5 Thoracic spine LAT 20 16 10 Lumbar spine AP 10 7 6 Lumbar spine LAT 30 20 14 Lumbar spine LSJ 40 35 27 Abdomen AP 10 7 6 Pelvis AP 10 5 4 Average2000/1985 = 0.56
Trends in UK DRLs for exams(1985 - 2000) Examination Dose-area product, Gy cm2 ___________________________________ 1985 1995 2000 IVU (urinary system) 40 25 16 Ba meal (stomach) 25 17 13 Ba enema (colon) 60 35 31 2000 1985 Average = 0.48
Trends in doses for CT(UK 1991 - 2003) 1991 (SSCT) 2003 (MSCT) ------------------------ -------------------------- CT exam DLP E DLP E (mGy cm) (mSv) (mGy cm) (mSv) Head * 1050 2 930 1.5 Chest * 650 8 580 5.8 Abdomen * 780 10 470 5.3 Pelvis 570 10 - - Abdo+pelvis - - 560 7.1 Chest+abdo+pelvis - - 940 9.9 * 2003/1991 = 0.8 - 0.5
Future problems in implementing ALARA Although doses are coming down for ‘old routine’ CT exams scanning speeds have increased and whole trunk scans (with higher doses) are becoming the ‘new routine’. Only radiologists can decide whether these increasing patient doses are ‘reasonable’ in relation to the extra diagnostic information obtained. BUT they need to be reminded regularly to consider if the doses are ALARA - through the use of DRLs. The major problems arise in trying to keep abreast of all these rapid developments in medical imaging and their impact on patient exposures, so that appropriate DRLs can be established to implement ALARA - ASAP